BenchmarkDotNet v0.11.2
This release includes many PRs from the Hacktoberfest. We are very grateful to all the contributors who spent their time to help us make BenchmarkDotNet even better!
Highlights
In this release, we have many improvements in different areas:
- Diagnosers
- EtwProfiler (allows profiling benchmarks on Windows and exporting the data to a trace file)
- Execution:
- Comparing NuGet packages (now it's possible to compare different versions of the same package)
- .NET Core 3.0 support
- Deferred Execution Validator
- Command-line:
--list: List of benchmarks--info: Print environment info--runtimes: Choosing execution runtimes (--runtimes net472 netcoreapp2.1will executed a benchmark on .NET 4.7.2 and .NET Core 2.1)- Options for number of invocations and iterations
- Custom default settings for console argument parser
- Case-insensitive filter
- Benchmarking with different CoreRun instances
- Hardware counters command-line support
- Exporters:
- Markdown output for DisassemblyDiagnoser
- Diff view for disassembler output
- Improved LINQPad support (colored monospaced logs)
- Better CPU brand strings
- Attributes:
- Async
[GlobalSetup]and[GlobalCleanup]support - Introduced
[ParamsAllValues] - Selecting Baseline across Methods and Jobs
- Async
- Statistics:
- Better statistical tests (Welch's t-test and Mann-Whitney U-test)
- ZeroMeasurementAnalyser
- RatioColumn
- Other:
- Azure Pipelines support for internal builds
- Many minor bug fixes
- Improved documentation
- New tests
Diagnosers
EtwProfiler
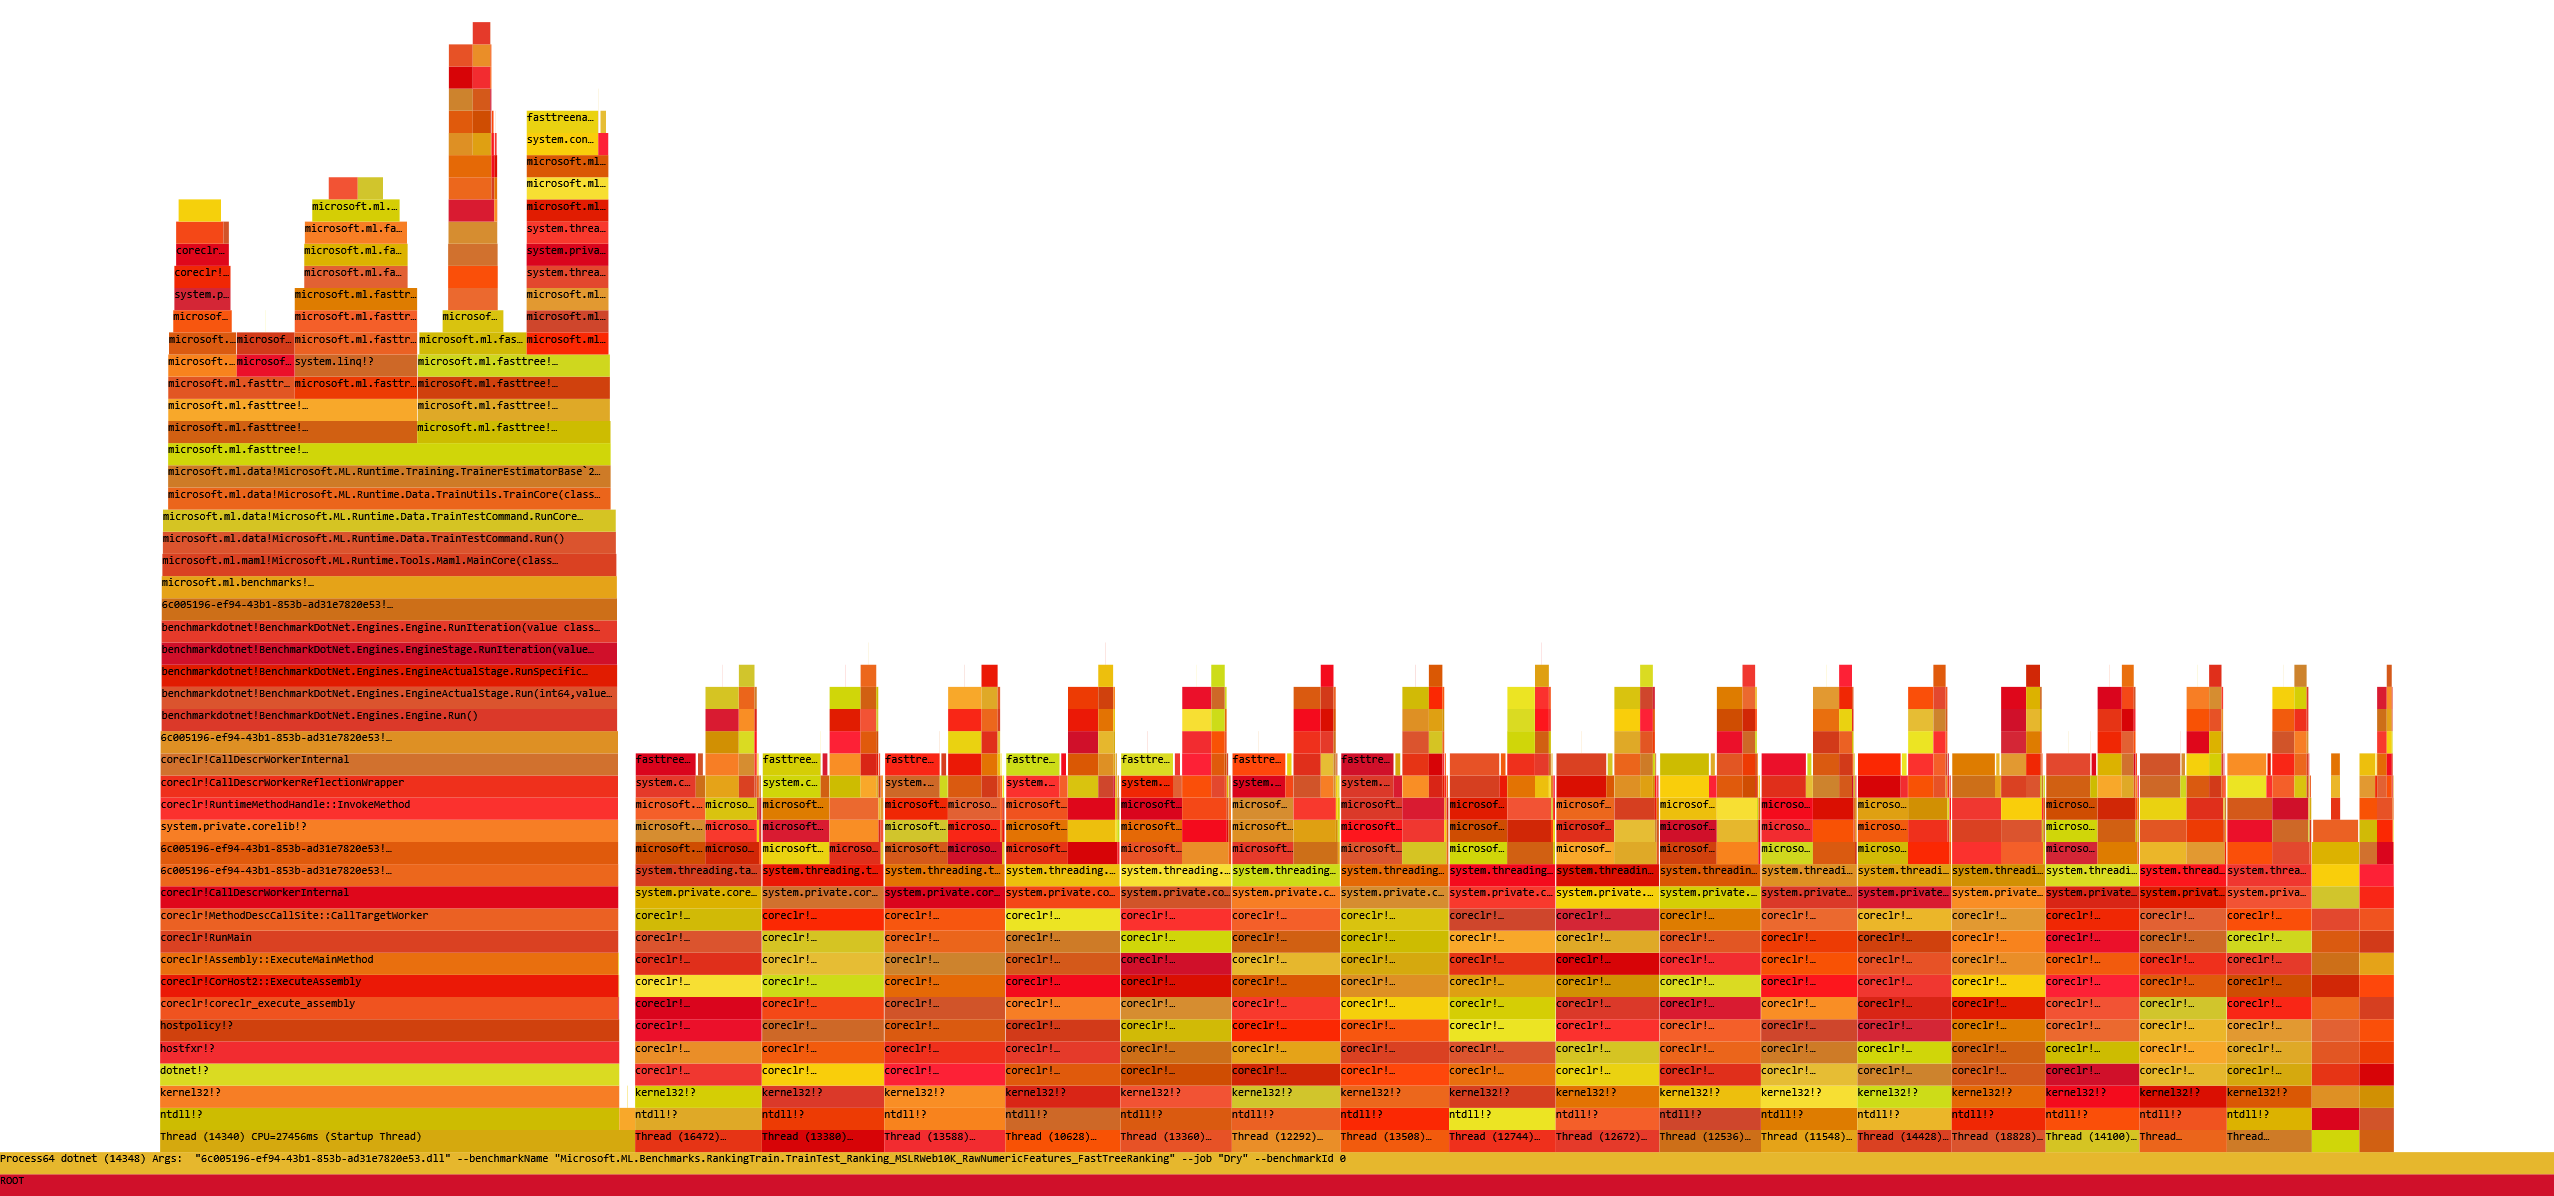
EtwProfiler allows to profile the benchmarked .NET code on Windows and exports the data to a trace file which can be opened with PerfView or Windows Performance Analyzer.
EtwProfiler uses TraceEvent library which internally uses Event Tracing for Windows (ETW) to capture stack traces and important .NET Runtime events.
Before the process with benchmarked code is started, EtwProfiler starts User and Kernel ETW sessions. Every session writes data to it's own file and captures different data. User session listens for the .NET Runtime events (GC, JIT etc) while the Kernel session gets CPU stacks and Hardware Counter events. After this, the process with benchmarked code is started. During the benchmark execution all the data is captured and written to a trace file. Moreover, BenchmarkDotNet Engine emits it's own events to be able to differentiate jitting, warmup, pilot and actual workload when analyzing the trace file. When the benchmarking is over, both sessions are closed and the two trace files are merged into one.
You can find more details in the documentation and in the blog post by Adam Sitnik.
- #878 EtwProfiler Diagnoser (by @adamsitnik)
- 04a715 EtwProfiler Diagnoser (#878) (by @adamsitnik)
Execution
Comparing NuGet packages
Now it's possible to compare performance of several versions of the same NuGet package. An example:
[Config(typeof(Config))]
public class IntroNuGet
{
  // Specify jobs with different versions of the same NuGet package to benchmark.
  // The NuGet versions referenced on these jobs must be greater or equal to the
  // same NuGet version referenced in this benchmark project.
  // Example: This benchmark project references Newtonsoft.Json 9.0.1
  private class Config : ManualConfig
  {
    public Config()
    {
      var baseJob = Job.MediumRun.With(CsProjCoreToolchain.Current.Value);
      Add(baseJob.WithNuGet("Newtonsoft.Json", "11.0.2").WithId("11.0.2"));
      Add(baseJob.WithNuGet("Newtonsoft.Json", "11.0.1").WithId("11.0.1"));
      Add(baseJob.WithNuGet("Newtonsoft.Json", "10.0.3").WithId("10.0.3"));
      Add(baseJob.WithNuGet("Newtonsoft.Json", "10.0.2").WithId("10.0.2"));
      Add(baseJob.WithNuGet("Newtonsoft.Json", "10.0.1").WithId("10.0.1"));
      Add(baseJob.WithNuGet("Newtonsoft.Json", "9.0.1").WithId("9.0.1"));
    }
  }

  [Benchmark]
  public void SerializeAnonymousObject()
    => JsonConvert.SerializeObject(
      new { hello = "world", price = 1.99, now = DateTime.UtcNow });
}
See also: BenchmarkDotNet.Samples.IntroNuGet
- #290 Question: Any official way to benchmark same method between different assembly versions?
- #931 Same NuGet version used when benchmarking different packages
- #922 Enables benchmarking betweeen different Nuget packages (by @Shazwazza)
- #932 Partition benchmark run info based on added nuget packages (by @blairconrad)
- 92a786 Enables benchmarking betweeen different Nuget packages (#922) fixes #290 (by @Shazwazza)
- 510685 Partition benchmark run info based on added nuget packages (#932) (by @blairconrad)
- cf84a4 NuGet casing fix (by @AndreyAkinshin)
.NET Core 3.0 support
Now it's possible to run benchmarks on preview versions of .NET Core 3.0.
- #874 .NET Core 3.0 support (assignee: @adamsitnik)
- 2e398c detect .NET Core 3.0 and use the appropriate target framework moniker, fixes ... (by @adamsitnik)
Deferred Execution Validator
In LINQ, execution of a query is usually deferred until the moment when you actually request the data. If your benchmark just returns IEnumerable or IQueryable it's not measuring the execution of the query, just the creation.
This is why we decided to warn you about this issue whenever it happens:
Benchmark IntroDeferredExecution.Wrong returns a deferred execution result (IEnumerable<Int32>). You need to either change the method declaration to return a materialized result or consume it on your own. You can use .Consume() extension method to do that.
Don't worry! We are also providing you with a Consume extension method which can execute given IEnumerable or IQueryable and consume its results. All you need to do is to create a Consumer instance, preferably store it in a field (to exclude the cost of creating Consumer from the benchmark itself) and pass it to Consume extension method.
Do not call .ToArray() because it's an expensive operation and it might dominate given benchmark!
See also: BenchmarkDotNet.Samples.IntroDeferredExecution
- #858 Should the Engine iterate over and consume IEnumerable and IQueryable results? (assignee: @adamsitnik)
- cebe2a Deferred Execution Validator, fixes #858 (by @adamsitnik)
Command-line
In this release, we have tons of improvements for command-line experience.
--list: List of benchmarks
The --list allows you to print all of the available benchmark names. Available options are:
flat- prints list of the available benchmarks:--list flat
BenchmarkDotNet.Samples.Algo_Md5VsSha256.Md5
BenchmarkDotNet.Samples.Algo_Md5VsSha256.Sha256
BenchmarkDotNet.Samples.IntroArguments.Benchmark
BenchmarkDotNet.Samples.IntroArgumentsSource.SingleArgument
BenchmarkDotNet.Samples.IntroArgumentsSource.ManyArguments
BenchmarkDotNet.Samples.IntroArrayParam.ArrayIndexOf
BenchmarkDotNet.Samples.IntroArrayParam.ManualIndexOf
BenchmarkDotNet.Samples.IntroBasic.Sleep
[...]
tree- prints tree of the available benchmarks:--list tree
BenchmarkDotNet
 └─Samples
    ├─Algo_Md5VsSha256
    │  ├─Md5
    │  └─Sha256
    ├─IntroArguments
    │  └─Benchmark
    ├─IntroArgumentsSource
    │  ├─SingleArgument
    │  └─ManyArguments
    ├─IntroArrayParam
    │  ├─ArrayIndexOf
    │  └─ManualIndexOf
    ├─IntroBasic
    │  ├─Sleep
[...]
The --list option works with the --filter option. Examples:
--list flat --filter *IntroSetupCleanup*prints:
BenchmarkDotNet.Samples.IntroSetupCleanupGlobal.Logic
BenchmarkDotNet.Samples.IntroSetupCleanupIteration.Benchmark
BenchmarkDotNet.Samples.IntroSetupCleanupTarget.BenchmarkA
BenchmarkDotNet.Samples.IntroSetupCleanupTarget.BenchmarkB
BenchmarkDotNet.Samples.IntroSetupCleanupTarget.BenchmarkC
BenchmarkDotNet.Samples.IntroSetupCleanupTarget.BenchmarkD
--list tree --filter *IntroSetupCleanup*prints:
BenchmarkDotNet
 └─Samples
    ├─IntroSetupCleanupGlobal
    │  └─Logic
    ├─IntroSetupCleanupIteration
    │  └─Benchmark
    └─IntroSetupCleanupTarget
       ├─BenchmarkA
       ├─BenchmarkB
       ├─BenchmarkC
       └─BenchmarkD
- #905 Implement
--list - #914 Implement
--list- fixes #905 (by @wojtpl2) - #916 Update console-args.md - add information about
--listoption (by @wojtpl2) - 330f66 Implement
--list- fixes #905 (#914) (by @wojtpl2) - 6c7521 Update console-args.md - add information about
--listoption (#916) (by @wojtpl2)
--info: Print environment info
Some of our users really like the info we print about hardware and OS.
Now we have the --info console line argument which does not run the benchmarks, but simply prints the info.
BenchmarkDotNet=v0.11.1.786-nightly, OS=Windows 10.0.17134.285 (1803/April2018Update/Redstone4)
Intel Xeon CPU E5-1650 v4 3.60GHz, 1 CPU, 12 logical and 6 physical cores
Frequency=3507500 Hz, Resolution=285.1033 ns, Timer=TSC
.NET Core SDK=3.0.100-alpha1-009642
  [Host] : .NET Core 3.0.0-preview1-27004-04 (CoreCLR 4.6.27003.04, CoreFX 4.6.27003.02), 64bit RyuJIT
- #904 Implement
--info - #907 fixes #904 Implement
--info(by @lahma) - 4be28d fixes #904 Implement
--info(#907) (by @lahma)
--runtimes: Choosing execution runtimes
The --runtimes or just -r allows you to run the benchmarks for selected Runtimes. Available options are: Mono, CoreRT, Core, Clr net46, net461, net462, net47, net471, net472, netcoreapp2.0, netcoreapp2.1, netcoreapp2.2, netcoreapp3.0.
Example: run the benchmarks for .NET 4.7.2 and .NET Core 2.1:
dotnet run -c Release -- --runtimes net472 netcoreapp2.1
- #913 .NET Core Toolchains improvements (by @adamsitnik)
- 0f721c make it possible to specify runtimes using explicit tfms like net472 or netco... (by @adamsitnik)
- 1c581e .NET Core Toolchains improvements (#913) (by @adamsitnik)
Options for number of invocations and iterations
--launchCount- how many times we should launch process with target benchmark. The default is 1.--warmupCount- how many warmup iterations should be performed. If you set it, the minWarmupCount and maxWarmupCount are ignored. By default calculated by the heuristic.--minWarmupCount- minimum count of warmup iterations that should be performed. The default is 6.--maxWarmupCount- maximum count of warmup iterations that should be performed. The default is 50.--iterationTime- desired time of execution of an iteration. Used by Pilot stage to estimate the number of invocations per iteration. 500ms by default.--iterationCount- how many target iterations should be performed. By default calculated by the heuristic.--minIterationCount- minimum number of iterations to run. The default is 15.--maxIterationCount- maximum number of iterations to run. The default is 100.--invocationCount- invocation count in a single iteration. By default calculated by the heuristic.--unrollFactor- how many times the benchmark method will be invoked per one iteration of a generated loop. 16 by default--runOncePerIteration- run the benchmark exactly once per iteration. False by default.
Example: run single warmup iteration, from 9 to 12 actual workload iterations.
dotnet run -c Release -- --warmupCount 1 --minIterationCount 9 --maxIterationCount 12
- #902 More command line args (by @adamsitnik)
- ba0d22 allow to configure the number of invocations and iterations from command line (by @adamsitnik)
Custom default settings for console argument parser
If you want to have a possibility to specify custom default Job settings programmatically and optionally overwrite it with console line arguments, then you should create a global config with single job marked as .AsDefault and pass it to BenchmarkSwitcher together with the console line arguments.
Example: run single warmup iteration by default.
static void Main(string[] args)
    => BenchmarkSwitcher
        .FromAssembly(typeof(Program).Assembly)
        .Run(args, GetGlobalConfig());

static IConfig GetGlobalConfig()
    => DefaultConfig.Instance
        .With(Job.Default
            .WithWarmupCount(1)
            .AsDefault()); // the KEY to get it working
Now, the default settings are: WarmupCount=1 but you might still overwrite it from console args like in the example below:
dotnet run -c Release -- --warmupCount 2
Case-insensitive filter
The --filter or just -f allows you to filter the benchmarks by their full name (namespace.typeName.methodName) using glob patterns.
Examples:
- Run all benchmarks from System.Memory namespace:
-f System.Memory* - Run all benchmarks:
-f * - Run all benchmarks from ClassA and ClassB
-f *ClassA* *ClassB*
Now this filter expression is case-insensitive.
- #864 Make the filter case insensitive (assignee: @adamsitnik)
- 106777 make the filter case insensitive invariant culture, fixes #864 (by @adamsitnik)
Benchmarking with different CoreRun instances
CoreRun is a simpler version of dotnet run, used for developing CoreCLR and CoreFX.
Typically when working on the performance of .NET Core a developer has more than 1 copy of CoreRun. Example: CoreRun before my changes, and after my changes. This change allows to simply run same benchmark for few different CoreRuns to compare the perf in easy way.
Sample usage:
dotnet run -c Release -f netcoreapp2.1 -- -f *Empty.method --job dry --coreRun
C:\Projects\coreclr_upstream\bin\tests\Windows_NT.x64.Release\Tests\Core_Root\CoreRun.exe
C:\Projects\coreclr_upstream\bin\tests\Windows_NT.x64.Release\Tests\Core_Root_beforeMyChanges\CoreRun.exe
Sample output:

- #925 Make it possible to run the benchmark with multiple CoreRun.exe (assignee: @adamsitnik)
- 901616 when user provides CoreRun path and runtime in explicit way, we should use th... (by @adamsitnik)
- 46bebf allow the users to run the same benchmarks using few different CoreRun.exe, f... (by @adamsitnik)
Hardware counters command-line support
--counters CacheMisses+InstructionRetired
- 1e3df7 make it possible to specify hardware counters from command line (by @adamsitnik)
- a4f91a better handling of edge cases for parsing hardware counters from the console ... (by @adamsitnik)
Exporters
Markdown output for DisassemblyDiagnoser
Now DisassemblyDiagnoser generates markdown version of the assembly listing.
- #560 Suggestion: markdown output for DisassemblyDiagnoser (assignee: @adamsitnik)
- 1e6235 github markdown exporter for Disassembler, fixes #560 (by @adamsitnik)
Diff view for disassembler output
Now we have PrettyGithubMarkdownDiffDisassemblyExporter which can generates
nice diffs between assembly listings.
This mode can be activated via the --disasmDiff command line argument or
the printDiff: true argument of DisassemblyDiagnoserConfig.
An output example (Diff between SumLocal and SumField on .NET Core 2.1.4 (CoreCLR 4.6.26814.03, CoreFX 4.6.26814.02), 64bit RyuJIT)
-; BenchmarkDotNet.Samples.IntroDisassemblyRyuJit.SumLocal()
-                   var local = field; // we use local variable that points to the field
-            ^^^^^^^^^^^^^^^^^^
-       mov     rax,qword ptr [rcx+8]
+; BenchmarkDotNet.Samples.IntroDisassemblyRyuJit.SumField()
                    int sum = 0;
             ^^^^^^^^^^^^
-       xor     edx,edx
-                   for (int i = 0; i < local.Length; i++)
+       xor     eax,eax
+                   for (int i = 0; i < field.Length; i++)
                  ^^^^^^^^^
-       xor     ecx,ecx
-                   for (int i = 0; i < local.Length; i++)
+       xor     edx,edx
+                   for (int i = 0; i < field.Length; i++)
                             ^^^^^^^^^^^^^^^^
-       mov     r8d,dword ptr [rax+8]
-       test    r8d,r8d
+       mov     rcx,qword ptr [rcx+8]
+       cmp     dword ptr [rcx+8],0
        jle     M00_L01
-                       sum += local[i];
+                       sum += field[i];
                 ^^^^^^^^^^^^^^^^
 M00_L00:
-       movsxd  r9,ecx
-       add     edx,dword ptr [rax+r9*4+10h]
-                   for (int i = 0; i < local.Length; i++)
+       mov     r8,rcx
+       cmp     edx,dword ptr [r8+8]
+       jae     00007ff9`0c412c1f
+       movsxd  r9,edx
+       add     eax,dword ptr [r8+r9*4+10h]
+                   for (int i = 0; i < field.Length; i++)
                                               ^^^
-       inc     ecx
-       cmp     r8d,ecx
+       inc     edx
+       cmp     dword ptr [rcx+8],edx
        jg      M00_L00
                    return sum;
             ^^^^^^^^^^^
 M00_L01:
-       mov     eax,edx
-; Total bytes of code 34
+       add     rsp,28h
+; Total bytes of code 42
- #544 Diff view for disassembler output (assignee: @wojtpl2)
- #927 Improve Disassembly exporters and add PrettyGithubMarkdownDiffDisassemblyExporter (by @wojtpl2)
- #936 Producing the asm diff reports on demand
- #937 Producing the asm diff reports on demand - fix for #936 (by @wojtpl2)
- 1903a1 Improve Disassembly exporters and add PrettyGithubMarkdownDiffDisassemblyExpo... (by @wojtpl2)
- dd103b Producing the asm diff reports on demand - fixes #936 (#937) (by @wojtpl2)
Improved LINQPad support
If you run BenchmarkDotNet v0.11.2+ in LINQPad, your logs will be colored and monospaced:

- #447 Implement ColoredLogger for LinqPad
- #903 Add LINQPad logging (by @bgrainger)
- #915 Use a monospaced font for LINQPad logging output (by @bgrainger)
- c3b609 Add LINQPad logging (#903) (by @bgrainger)
- 10fdd0 Use a monospaced font for LINQPad logging output. (#915) (by @bgrainger)
Better CPU brand strings
We did a lot of changes which improve the presentation form of the CPU brand string. Here is an example of such string in the previous version of BenchmarkDotNet:
AMD Ryzen 7 2700X Eight-Core Processor (Max: 4.10GHz), 1 CPU, 16 logical and 8 physical cores
Now it becomes:
AMD Ryzen 7 2700X 4.10GHz, 1 CPU, 16 logical and 8 physical cores
As you can see, "Eight-Core Processor" was removed (because we already have "8 physical cores"); "(Max: 4.10GHz)" was replaced by 4.10GHz (because the original CPU brand string doesn't contain the nominal frequency).
- #859 Strange max frequency values on Windows (assignee: @Rizzen)
- #909 Improve CPU Brand Strings without frequency
- #860 Fix strange CPU Frequency values (by @Rizzen)
- #910 Simplify AMD Ryzen CPU brand info (by @lahma)
- a78b38 Fix strange CPU Frequency values (#860) (by @Rizzen)
- 5df1e6 Simplify AMD Ryzen CPU brand info (#910) (by @lahma)
Attributes
Async GlobalSetup and GlobalCleanup
Now GlobalSetup and GlobalCleanup methods can be async.
See also: docs.setup-and-cleanup
- #521 Support async Setup/Cleanup
- #892 Added support for async GlobalSetup. (by @dlemstra)
- #923 async GlobalCleanup support (by @dlemstra)
- #926 Added support for async GlobalCleanup. (by @dlemstra)
- e0f7a6 Added support for async GlobalSetup. (#892) (by @dlemstra)
- a971a4 async GlobalCleanup support (#923) (by @dlemstra)
- e4c7b8 Added support for async GlobalCleanup. (#926), fixes #521 (by @dlemstra)
Introduced ParamsAllValues
If you want to use all possible values of an enum or another type with a small number of values, you can use the [ParamsAllValues] attribute, instead of listing all the values by hand. The types supported by the attribute are:
bool- any
enumthat is not marked with[Flags] Nullable<T>, whereTis an enum or boolean
An example:
public class IntroParamsAllValues
{
    public enum CustomEnum
    {
        A,
        BB,
        CCC
    }

    [ParamsAllValues]
    public CustomEnum E { get; set; }

    [ParamsAllValues]
    public bool? B { get; set; }

    [Benchmark]
    public void Benchmark()
    {
        Thread.Sleep(
            E.ToString().Length * 100 +
            (B == true ? 20 : B == false ? 10 : 0));
    }
}
Output:
    Method |   E |     B |     Mean | Error |
---------- |---- |------ |---------:|------:|
 Benchmark |   A |     ? | 101.9 ms |    NA |
 Benchmark |   A | False | 111.9 ms |    NA |
 Benchmark |   A |  True | 122.3 ms |    NA |
 Benchmark |  BB |     ? | 201.5 ms |    NA |
 Benchmark |  BB | False | 211.8 ms |    NA |
 Benchmark |  BB |  True | 221.4 ms |    NA |
 Benchmark | CCC |     ? | 301.8 ms |    NA |
 Benchmark | CCC | False | 312.3 ms |    NA |
 Benchmark | CCC |  True | 322.2 ms |    NA |

// * Legends *
  E     : Value of the 'E' parameter
  B     : Value of the 'B' parameter
- #658 [Params] for enums should include all values by default
- #908 Added [ParamsAllValues] (by @gsomix)
- 922dff Added [ParamsAllValues] (#908), fixes #658 (by @gsomix)
- 846d08 ParamsAllValuesValidator fixes (by @AndreyAkinshin)
Selecting Baseline across Methods and Jobs
Now it's possible to mark a method and a job as baselines at the same time:
public class TheBaselines
{
    [Benchmark(Baseline = true)]
    public void Sleep100ms() => Thread.Sleep(TimeSpan.FromMilliseconds(100));

    [Benchmark]
    public void Sleep50ms() => Thread.Sleep(TimeSpan.FromMilliseconds(50));
}

static void Main(string[] args)
    => BenchmarkSwitcher
        .FromTypes(new[] { typeof(TheBaselines) })
        .Run(args,
                DefaultConfig.Instance
                    .With(Job.Core.AsBaseline())
                    .With(Job.Clr.WithId("CLR 4.7.2")));
- #880 Select Baseline across Methods and Jobs (assignee: @AndreyAkinshin)
- 21a007 Support method-job baseline pairs, fixes #880 (by @AndreyAkinshin)
Statistics
Statistical tests
In this release, statistical testing was significantly improved. Now it's possible to compare all benchmarks against baseline with the help of Welch's t-test or Mann–Whitney U test.
An example:
[StatisticalTestColumn(
    StatisticalTestKind.Welch, ThresholdUnit.Microseconds, 1, true)]
[StatisticalTestColumn(
    StatisticalTestKind.MannWhitney, ThresholdUnit.Microseconds, 1, true)]
[StatisticalTestColumn(
    StatisticalTestKind.Welch, ThresholdUnit.Ratio, 0.03, true)]
[StatisticalTestColumn(
    StatisticalTestKind.MannWhitney, ThresholdUnit.Ratio, 0.03, true)]
[SimpleJob(warmupCount: 0, targetCount: 5)]
public class IntroStatisticalTesting
{
    [Benchmark] public void Sleep50() => Thread.Sleep(50);
    [Benchmark] public void Sleep97() => Thread.Sleep(97);
    [Benchmark] public void Sleep99() => Thread.Sleep(99);
    [Benchmark(Baseline = true)] public void Sleep100() => Thread.Sleep(100);
    [Benchmark] public void Sleep101() => Thread.Sleep(101);
    [Benchmark] public void Sleep103() => Thread.Sleep(103);
    [Benchmark] public void Sleep150() => Thread.Sleep(150);
}
Output:
| Method | Mean | Error | StdDev | Ratio | Welch(1us)/p-values | Welch(3%)/p-values | MannWhitney(1us)/p-values | MannWhitney(3%)/p-values |
|---|---|---|---|---|---|---|---|---|
| Sleep50 | 53.13 ms | 0.5901 ms | 0.1532 ms | 0.51 | Faster: 1.0000/0.0000 | Faster: 1.0000/0.0000 | Faster: 1.0000/0.0040 | Faster: 1.0000/0.0040 |
| Sleep97 | 100.07 ms | 0.9093 ms | 0.2361 ms | 0.97 | Faster: 1.0000/0.0000 | Same: 1.0000/0.1290 | Faster: 1.0000/0.0040 | Same: 1.0000/0.1111 |
| Sleep99 | 102.23 ms | 2.4462 ms | 0.6353 ms | 0.99 | Faster: 0.9928/0.0072 | Same: 1.0000/0.9994 | Faster: 0.9960/0.0079 | Same: 1.0000/1.0000 |
| Sleep100 | 103.34 ms | 0.8180 ms | 0.2124 ms | 1.00 | Base: 0.5029/0.5029 | Base: 1.0000/1.0000 | Base: 0.7262/0.7262 | Base: 1.0000/1.0000 |
| Sleep101 | 103.73 ms | 2.1591 ms | 0.5607 ms | 1.00 | Same: 0.1041/0.8969 | Same: 0.9999/1.0000 | Same: 0.1111/0.9246 | Same: 1.0000/1.0000 |
| Sleep103 | 106.21 ms | 1.2511 ms | 0.3249 ms | 1.03 | Slower: 0.0000/1.0000 | Same: 0.9447/1.0000 | Slower: 0.0040/1.0000 | Same: 0.9246/1.0000 |
| Sleep150 | 153.16 ms | 3.4929 ms | 0.9071 ms | 1.48 | Slower: 0.0000/1.0000 | Slower: 0.0000/1.0000 | Slower: 0.0040/1.0000 | Slower: 0.0040/1.0000 |
// * Legends *
  Mean                      : Arithmetic mean of all measurements
  Error                     : Half of 99.9% confidence interval
  StdDev                    : Standard deviation of all measurements
  Ratio                     : Mean of the ratio distribution ([Current]/[Baseline])
  Welch(1us)/p-values       : Welch-based TOST equivalence test with 1 us threshold. Format: 'Result: p-value(Slower)|p-value(Faster)'
  Welch(3%)/p-values        : Welch-based TOST equivalence test with 3% threshold. Format: 'Result: p-value(Slower)|p-value(Faster)'
  MannWhitney(1us)/p-values : MannWhitney-based TOST equivalence test with 1 us threshold. Format: 'Result: p-value(Slower)|p-value(Faster)'
  MannWhitney(3%)/p-values  : MannWhitney-based TOST equivalence test with 3% threshold. Format: 'Result: p-value(Slower)|p-value(Faster)'
  1 ms                      : 1 Millisecond (0.001 sec)
The statistical testing is a work-in-progress feature. In future versions of BenchmarkDotNet, we are planning to improve API, fill missed docs, and introduce more parameters for customization.
See also: BenchmarkDotNet.Samples.IntroStatisticalTesting
- 60eca0 Threshold API for WelchTTest; Improve Student accuracy for small n (by @AndreyAkinshin)
- 05cc8d Statistical testing improvements (by @AndreyAkinshin)
ZeroMeasurementAnalyser
When you have an empty benchmark like this
[Benchmark]
public void Empty() { }
The expected duration of this method is zero.
However, you can get the mean value like 0.0023ns because of the natural noise.
It's a pretty confusing result for many developers.
Since v0.11.2, we have ZeroMeasurementAnalyser which warn you about such methods.
By default, BenchmarkDotNet automatically evaluate overhead.
In this case, ZeroMeasurementAnalyser runs Welch's t-test and compare actual and overhead measurements.
If the overhead evaluation is disabled, it runs one-sample Student's t-test against a half of CPU cycle.
RatioColumn
The Ratio column was formerly known as Scaled.
The old title was a source of misunderstanding and confusion because
many developers interpreted it as the ratio of means (e.g., 50.46/100.39 for Time50).
The ratio of distribution means and the mean of the ratio distribution are pretty close to each other in most cases,
but they are not equal.
See also: BenchmarkDotNet.Samples.IntroBenchmarkBaseline, BenchmarkDotNet.Samples.IntroRatioSD, Benchmark and Job Baselines.
- 4e64c9 Ratio/RatioSD columns (by @AndreyAkinshin)
Milestone details
In the v0.11.2 scope, 28 issues were resolved and 33 pull requests were merged. This release includes 84 commits by 20 contributors.
Resolved issues (28)
- #221 Investigate why CanEnableServerGcMode test fails for Core on appveyor
- #290 Question: Any official way to benchmark same method between different assembly versions?
- #447 Implement ColoredLogger for LinqPad
- #521 Support async Setup/Cleanup
- #544 Diff view for disassembler output (assignee: @WojciechNagorski)
- #560 Suggestion: markdown output for DisassemblyDiagnoser (assignee: @adamsitnik)
- #601 Surprising results
- #658 [Params] for enums should include all values by default
- #731 Add constant folding analyser
- #788 Detect correct version of .NET Core in Docket container
- #842 Benchmark filter: wildcards on *nix CLI (assignee: @adamsitnik)
- #858 Should the Engine iterate over and consume IEnumerable and IQueryable results? (assignee: @adamsitnik)
- #859 Strange max frequency values on Windows (assignee: @Rizzen)
- #862 Don't print parse errors to the output (assignee: @adamsitnik)
- #863 Make it easier to understand which process belongs to which benchmark (assignee: @adamsitnik)
- #864 Make the filter case insensitive (assignee: @adamsitnik)
- #874 .NET Core 3.0 support (assignee: @adamsitnik)
- #879 Benchmark attributed with "HardwareCounters" throws an exception (assignee: @adamsitnik)
- #880 Select Baseline across Methods and Jobs (assignee: @AndreyAkinshin)
- #889 ArgumentsSource doesn't work if method takes 1 arg (assignee: @adamsitnik)
- #891 Add docs about debugging BDN issues (assignee: @adamsitnik)
- #904 Implement
--info - #905 Implement
--list - #909 Improve CPU Brand Strings without frequency
- #911 Excluding specific namespaces from disassembly (assignee: @adamsitnik)
- #925 Make it possible to run the benchmark with multiple CoreRun.exe (assignee: @adamsitnik)
- #931 Same NuGet version used when benchmarking different packages
- #936 Producing the asm diff reports on demand
Merged pull requests (33)
- #860 Fix strange CPU Frequency values (by @Rizzen)
- #878 EtwProfiler Diagnoser (by @adamsitnik)
- #886 Enabled GcModeTests.CanEnableServerGcMode (by @dlemstra)
- #887 Dependencies update (by @adamsitnik)
- #888 Fix duplicate example in RunStrategy guide (by @SteveDesmond-ca)
- #890 RPlotExporter: use https to download dependencies (by @xavero)
- #892 Added support for async GlobalSetup. (by @dlemstra)
- #894 Fix GlobalCleanupAttributeTest.GlobalCleanupMethodRunsTest (by @dlemstra)
- #898 Add workaround for Full framework on *NIX (by @mfilippov)
- #900 Fixing aspnet/KestrelHttpServer url (by @facundofarias)
- #901 Fixing SignalR and EntityFrameworkCore url as well (by @facundofarias)
- #902 More command line args (by @adamsitnik)
- #903 Add LINQPad logging (by @bgrainger)
- #906 Zero measurement analyser (by @Rizzen)
- #907 fixes #904 Implement
--info(by @lahma) - #908 Added [ParamsAllValues] (by @gsomix)
- #910 Simplify AMD Ryzen CPU brand info (by @lahma)
- #913 .NET Core Toolchains improvements (by @adamsitnik)
- #914 Implement
--list- fixes #905 (by @WojciechNagorski) - #915 Use a monospaced font for LINQPad logging output (by @bgrainger)
- #916 Update console-args.md - add information about
--listoption (by @WojciechNagorski) - #917 Add Azure Pipelines support (by @Ky7m)
- #920 OCD Whitespace and tabs cleanup (by @dlemstra)
- #922 Enables benchmarking betweeen different Nuget packages (by @Shazwazza)
- #923 async GlobalCleanup support (by @dlemstra)
- #926 Added support for async GlobalCleanup. (by @dlemstra)
- #927 Improve Disassembly exporters and add PrettyGithubMarkdownDiffDisassemblyExporter (by @WojciechNagorski)
- #929 Add build status badges for Azure Pipelines (by @Ky7m)
- #930 Fix minor spelling issues and typos (by @KonH)
- #932 Partition benchmark run info based on added nuget packages (by @blairconrad)
- #934 Detect correct version of .NET Core in Docker (by @Rizzen)
- #935 Add Timeout for dotnet cli build commands to our toolchains (by @adamsitnik)
- #937 Producing the asm diff reports on demand - fix for #936 (by @WojciechNagorski)
Commits (84)
- 22b020 Postrelease update of v0.11.1 changelog (by @AndreyAkinshin)
- 3e26df docs: fix NuGet package lists in footers (v0.11.x) (by @AndreyAkinshin)
- cebe2a Deferred Execution Validator, fixes #858 (by @adamsitnik)
- 50fd57 exported json file should contain correct type name for generic types, not Ge... (by @adamsitnik)
- 30b885 benchmarked code can be defining IHost so we need to provide full name (examp... (by @adamsitnik)
- b7104e Don't print parse errors to the output, fixes #862 (by @adamsitnik)
- 3a21b4 Make it easier to understand which process belongs to which benchmark, fixes ... (by @adamsitnik)
- 99ea2d Fix behavior of Baseline property of Benchmark attribute in integration with ... (by @Caballero77)
- 2e398c detect .NET Core 3.0 and use the appropriate target framework moniker, fixes ... (by @adamsitnik)
- ff1214 Update IntroSetupCleanupTarget.md (#876) (by @fredeil)
- 1721b4 Fixed typo in the NodaTime name (#877) (by @YohDeadfall)
- f411a5 Fix typo in example code (#869) (by @NRKirby)
- 21a007 Support method-job baseline pairs, fixes #880 (by @AndreyAkinshin)
- a78b38 Fix strange CPU Frequency values (#860) (by @Rizzen)
- 60eca0 Threshold API for WelchTTest; Improve Student accuracy for small n (by @AndreyAkinshin)
- 05cc8d Statistical testing improvements (by @AndreyAkinshin)
- 557752 Fix compilation (by @AndreyAkinshin)
- a03307 Enabled GcModeTests.CanEnableServerGcMode (#886) fixes #221 (by @dlemstra)
- add585 Fix duplicate example in RunStrategy guide (#888) (by @SteveDesmond-ca)
- d8b008 Use NoInlining for CommonExporterApprovalTests (by @AndreyAkinshin)
- eacfd7 Dependencies update (#887) (by @adamsitnik)
- 579986 improve the docs, explain how to use ArgumentsSource for single arugment, fix... (by @adamsitnik)
- 1ceee3 Fix compilation after merge (by @AndreyAkinshin)
- 9ff772 RPlotExporter: use https to download dependencies (#890) (by @xavero)
- 41d6b8 added xml docs, made some methods virtual/public to make it easier to write y... (by @adamsitnik)
- cd0791 restore --no-dependencies was good when we were generating multiple projects,... (by @adamsitnik)
- ad1feb expose KeepBenchmarkFiles as --keepFiles command line argument, #891 (by @adamsitnik)
- 6880b5 add DebugInProcessConfig and DebugBuildConfig to make troubleshooting easier,... (by @adamsitnik)
- 12e01a add Troubleshooting docs, fixes #891 (by @adamsitnik)
- 106777 make the filter case insensitive invariant culture, fixes #864 (by @adamsitnik)
- 1b8051 wrap * in '*' on Unix when showing users the help, fixes #842 (by @adamsitnik)
- 382a4a Fix GlobalCleanupAttributeTest.GlobalCleanupMethodRunsTest (#894) (by @dlemstra)
- 0f721c make it possible to specify runtimes using explicit tfms like net472 or netco... (by @adamsitnik)
- 1e3df7 make it possible to specify hardware counters from command line (by @adamsitnik)
- ba0d22 allow to configure the number of invocations and iterations from command line (by @adamsitnik)
- b90be6 Add workaround for Full framework on *NIX (#898) (by @mfilippov)
- 4afdb8 Fixing aspnet/KestrelHttpServer url (#900) (by @facundofarias)
- 3319ab Fixing SignalR and EntityFrameworkCore url as well (#901) (by @facundofarias)
- b72aab allow the users to specify programmatically custom default job settings and o... (by @adamsitnik)
- 2e7042 Merge pull request #902 from dotnet/moreCommandLineArgs (by @adamsitnik)
- 04a715 EtwProfiler Diagnoser (#878) (by @adamsitnik)
- 220bae DotNetCliGenerator.TargetFrameworkMoniker must be public (by @adamsitnik)
- 4e64c9 Ratio/RatioSD columns (by @AndreyAkinshin)
- 177c07 Add Windows 10 (1809) in OsBrandStringHelper (by @AndreyAkinshin)
- 4be28d fixes #904 Implement
--info(#907) (by @lahma) - c3b609 Add LINQPad logging (#903) (by @bgrainger)
- 922dff Added [ParamsAllValues] (#908), fixes #658 (by @gsomix)
- 1e6235 github markdown exporter for Disassembler, fixes #560 (by @adamsitnik)
- 330f66 Implement
--list- fixes #905 (#914) (by @WojciechNagorski) - 10fdd0 Use a monospaced font for LINQPad logging output. (#915) (by @bgrainger)
- 846d08 ParamsAllValuesValidator fixes (by @AndreyAkinshin)
- 1c581e .NET Core Toolchains improvements (#913) (by @adamsitnik)
- 8949df BenchmarkSwitcher should ask the user for choosing the benchmarks when the gl... (by @adamsitnik)
- fb8f89 Make WindowsDisassembler public to allow for late resutls filtering in diagno... (by @adamsitnik)
- 0bcbce allow configuring disasm recursive depth from console line arguments; --todo; (by @adamsitnik)
- 5e3cee make sure BenchmarkSwitcher handles all possible cases and gives nice errors (by @adamsitnik)
- 6c7521 Update console-args.md - add information about
--listoption (#916) (by @WojciechNagorski) - 8773ff when user provides categories via command line to benchmark switcher we don't... (by @adamsitnik)
- 901616 when user provides CoreRun path and runtime in explicit way, we should use th... (by @adamsitnik)
- 5df1e6 Simplify AMD Ryzen CPU brand info (#910) (by @lahma)
- 1b4c7f OCD Whitespace and tabs cleanup (#920) (by @dlemstra)
- d917e6 don't parse the trace file if there are no counters configured, wait for dela... (by @adamsitnik)
- e0f7a6 Added support for async GlobalSetup. (#892) (by @dlemstra)
- 46bebf allow the users to run the same benchmarks using few different CoreRun.exe, f... (by @adamsitnik)
- a4f91a better handling of edge cases for parsing hardware counters from the console ... (by @adamsitnik)
- 98925b initial 0.11.2 release notes (by @adamsitnik)
- a971a4 async GlobalCleanup support (#923) (by @dlemstra)
- e4c7b8 Added support for async GlobalCleanup. (#926), fixes #521 (by @dlemstra)
- 92a786 Enables benchmarking betweeen different Nuget packages (#922) fixes #290 (by @Shazwazza)
- 601c66 Add Azure Pipelines support (#917) (by @Ky7m)
- f9ac68 Add build status badges (#929) (by @Ky7m)
- 8a2eec Fix minor spelling issues and typos (#930) (by @KonH)
- 510685 Partition benchmark run info based on added nuget packages (#932) (by @blairconrad)
- 1903a1 Improve Disassembly exporters and add PrettyGithubMarkdownDiffDisassemblyExpo... (by @WojciechNagorski)
- 48d193 Zero measurement analyser (#906) (by @Rizzen)
- cf84a4 NuGet casing fix (by @AndreyAkinshin)
- fd459f Remove remark about prerelease version in etwprofiler.md (by @AndreyAkinshin)
- db444c Add Timeout for dotnet cli build commands to our toolchains (#935) fixes #933 (by @adamsitnik)
- bb0b18 Detect correct version of .NET Core in Docker (#934), fixes #788 (by @Rizzen)
- dd103b Producing the asm diff reports on demand - fixes #936 (#937) (by @WojciechNagorski)
- 864400 Update v0.11.2 changelog (by @AndreyAkinshin)
- 15c035 Minor IntroSamples fixes (by @AndreyAkinshin)
- a5b692 Update v0.11.2 changelog (by @AndreyAkinshin)
- 2341c7 Set library version: 0.11.2 (by @AndreyAkinshin)
Contributors (20)
- Adam Sitnik (@adamsitnik)
- Andrey Akinshin (@AndreyAkinshin)
- Blair Conrad (@blairconrad)
- Bradley Grainger (@bgrainger)
- Caballero77 (@Caballero77)
- Dirk Lemstra (@dlemstra)
- Evgeniy Andreev (@gsomix)
- Facundo Farias (@facundofarias)
- Flavio Coelho (@xavero)
- Fredrik Eilertsen (@fredeil)
- Igor Fesenko (@Ky7m)
- KonH (@KonH)
- Mark Tkachenko (@Rizzen)
- Marko Lahma (@lahma)
- Mikhail Filippov (@mfilippov)
- Nick Kirby (@NRKirby)
- Shannon Deminick (@Shazwazza)
- Steve Desmond (@SteveDesmond-ca)
- Wojciech Nagórski (@WojciechNagorski)
- Yoh Deadfall (@YohDeadfall)
Thank you very much!
Additional details
Date: November 1, 2018
Milestone: v0.11.2 (List of commits)
NuGet Packages: