EtwProfiler
EtwProfiler allows to profile the benchmarked .NET code on Windows and exports the data to a trace file which can be opened with PerfView or Windows Performance Analyzer.
How it works
EtwProfiler uses TraceEvent library which internally uses Event Tracing for Windows (ETW) to capture stack traces and important .NET Runtime events.
Before the process with benchmarked code is started, EtwProfiler starts User and Kernel ETW sessions. Every session writes data to it's own file and captures different data. User session listens for the .NET Runtime events (GC, JIT etc) while the Kernel session gets CPU stacks and Hardware Counter events. After this, the process with benchmarked code is started. During the benchmark execution all the data is captured and written to a trace file. Moreover, BenchmarkDotNet Engine emits it's own events to be able to differentiate jitting, warmup, pilot and actual workload when analyzing the trace file. When the benchmarking is over, both sessions are closed and the two trace files are merged into one.
Limitations
What we have today comes with following limitations:
- EtwProfiler works only on Windows (one day we might implement similar thing for Unix using EventPipe)
- Requires to run as Admin (to create ETW Kernel Session)
- No
InProcessToolchainsupport - To get the best possible managed code symbols you should configure your project in following way:
<DebugType>pdbonly</DebugType>
<DebugSymbols>true</DebugSymbols>
Note
On certain machines Intel TDT and Windows Defender can cause CPU samples to be captured with no value.
You can correct this problem by disabling the feature using powershell.exe Set-MpPreference -DisableTDTFeature $true.
WARNING: Disabling security features will make your machine less secure; do so at your own risk.
How to use it?
You need to install BenchmarkDotNet.Diagnostics.Windows package.
It can be enabled in few ways, some of them:
- Use the new attribute (apply it on a class that contains Benchmarks):
using BenchmarkDotNet.Diagnostics.Windows.Configs;

[EtwProfiler]
public class TheClassThatContainsBenchmarks { /* benchmarks go here */ }
- Extend the
DefaultConfig.Instancewith new instance ofEtwProfiler:
class Program
{
    static void Main(string[] args)
        => BenchmarkSwitcher
            .FromAssembly(typeof(Program).Assembly)
            .Run(args,
                DefaultConfig.Instance
                    .AddDiagnoser(new EtwProfiler())); // HERE
}
- Passing
-p ETWor--profiler ETWcommand line argument toBenchmarkSwitcher
Configuration
To configure the new diagnoser you need to create an instance of EtwProfilerConfig class and pass it to the EtwProfiler constructor. The parameters that EtwProfilerConfig ctor takes are:
performExtraBenchmarksRun- if set to true, benchmarks will be executed one more time with the profiler attached. If set to false, there will be no extra run but the results will contain overhead. True by default.bufferSizeInMb- ETW session buffer size, in MB. 256 by default.intervalSelectors- interval per hardware counter, if not provided then default values will be used.kernelKeywords- kernel session keywords, ImageLoad (for native stack frames) and Profile (for CPU Stacks) are the defaults.providers- providers that should be enabled, if not provided then default values will be used.
Using PerfView to work with trace files
PerfView is a free .NET profiler from Microsoft. If you don't know how to use it you should watch these instructional videos first.
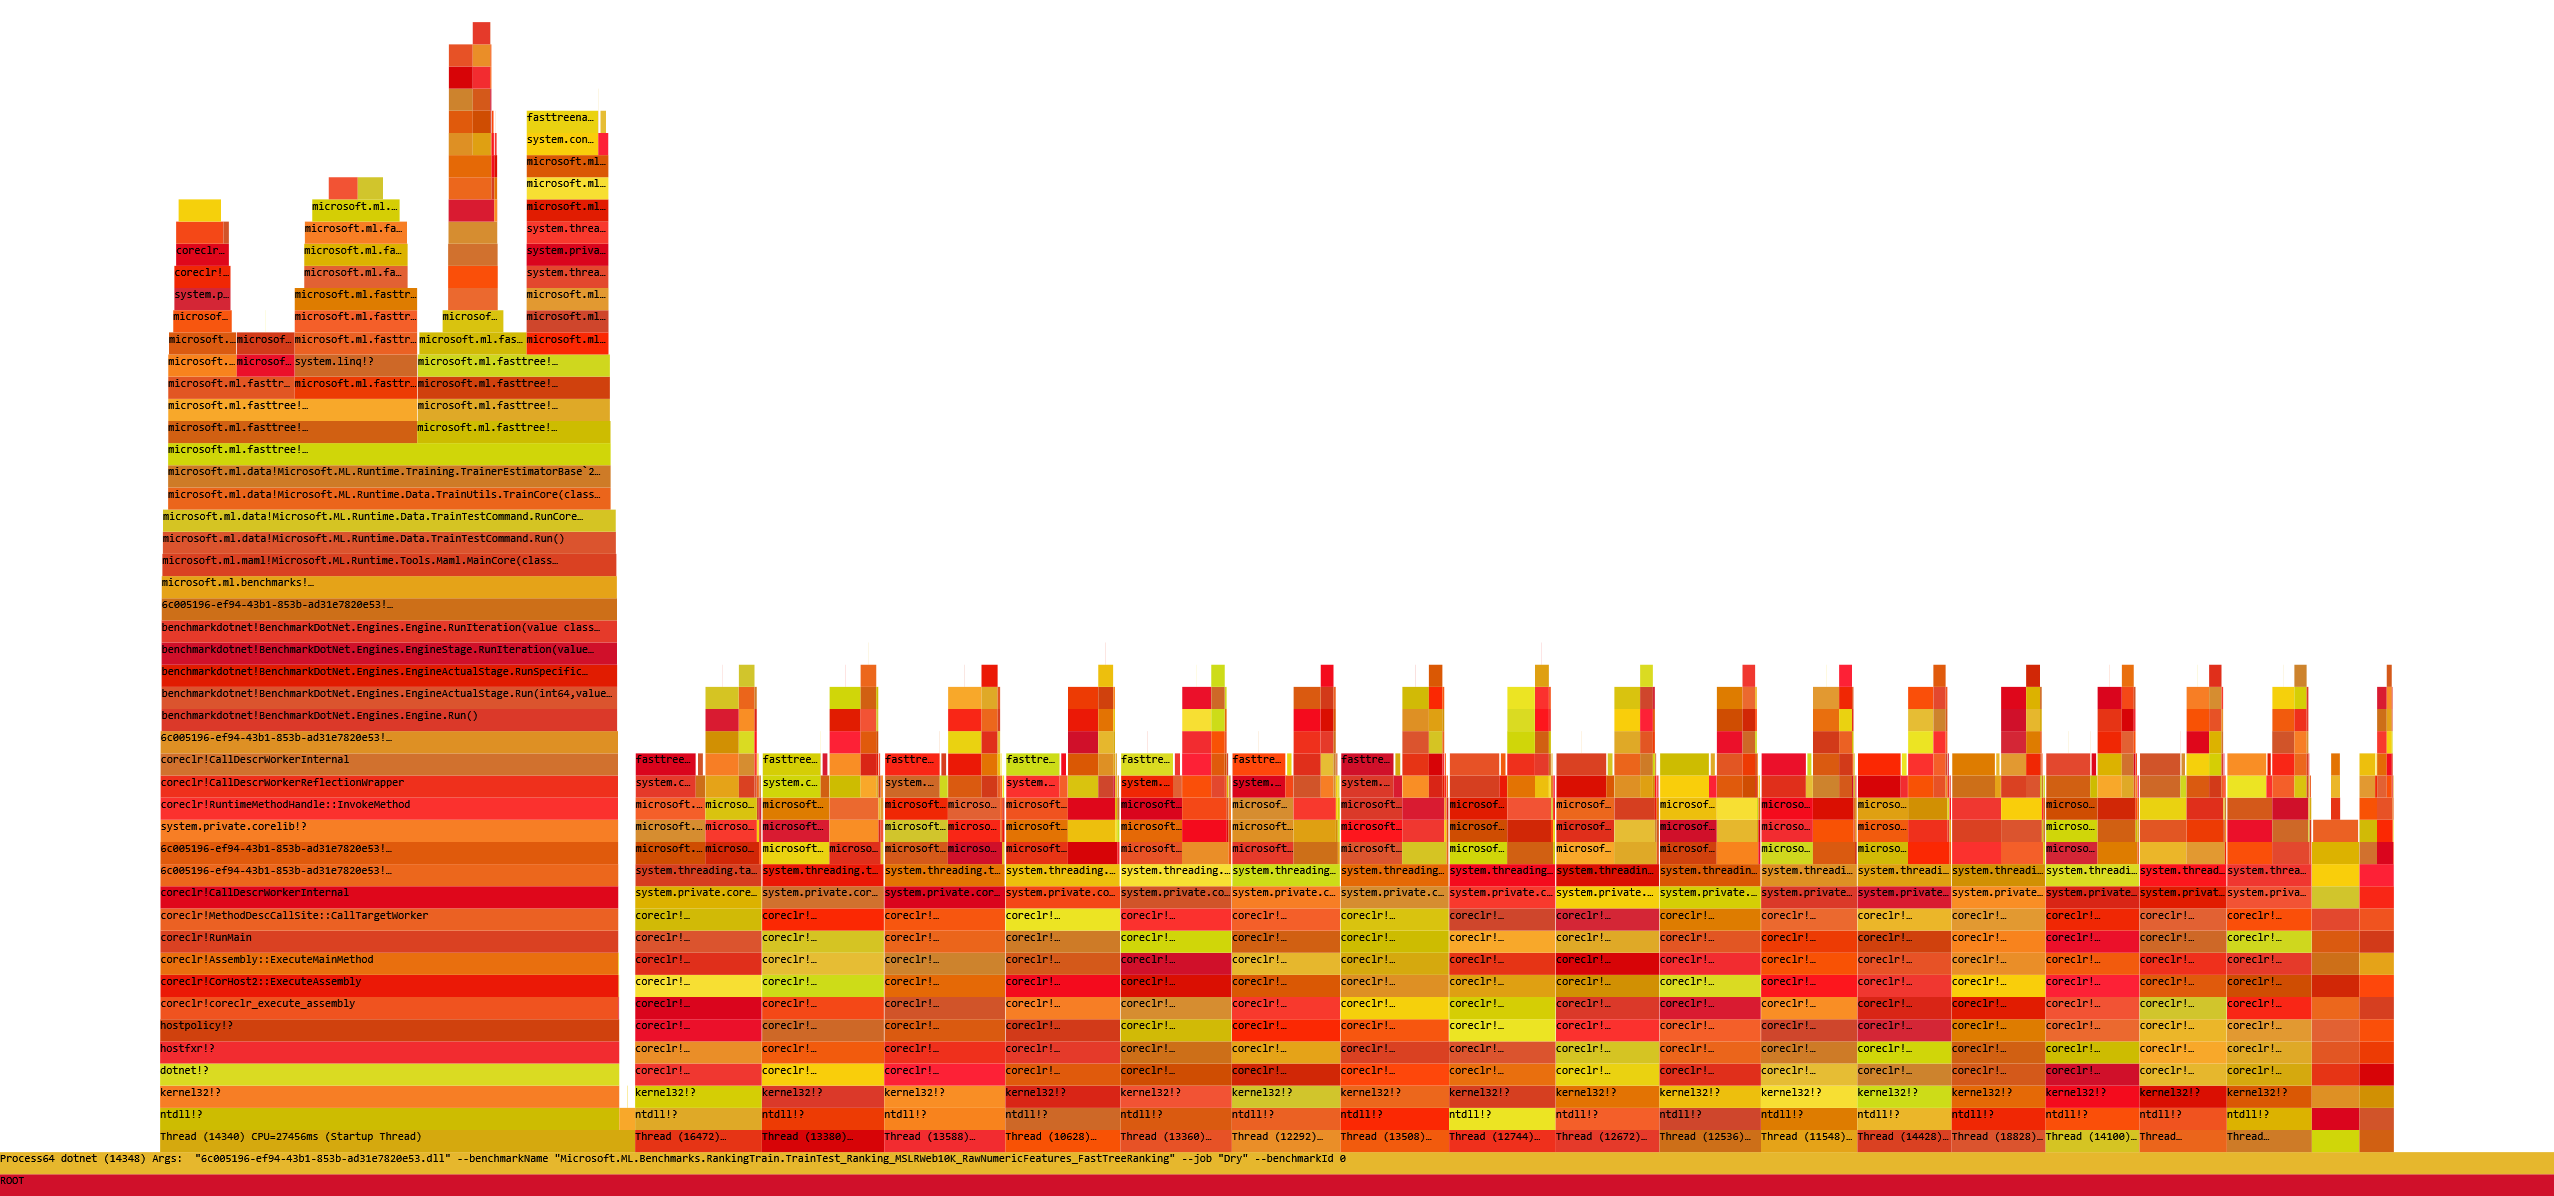
If you are familiar with PerfView, then the only thing you need to know is that BenchmarkDotNet performs Jitting by running the code once, Pilot Experiment to determine how many times benchmark should be executed per iteration, non-trivial Warmup and Actual Workload. This is why when you open your trace file in PerfView you will see your benchmark in a few different places of the StackTrace.
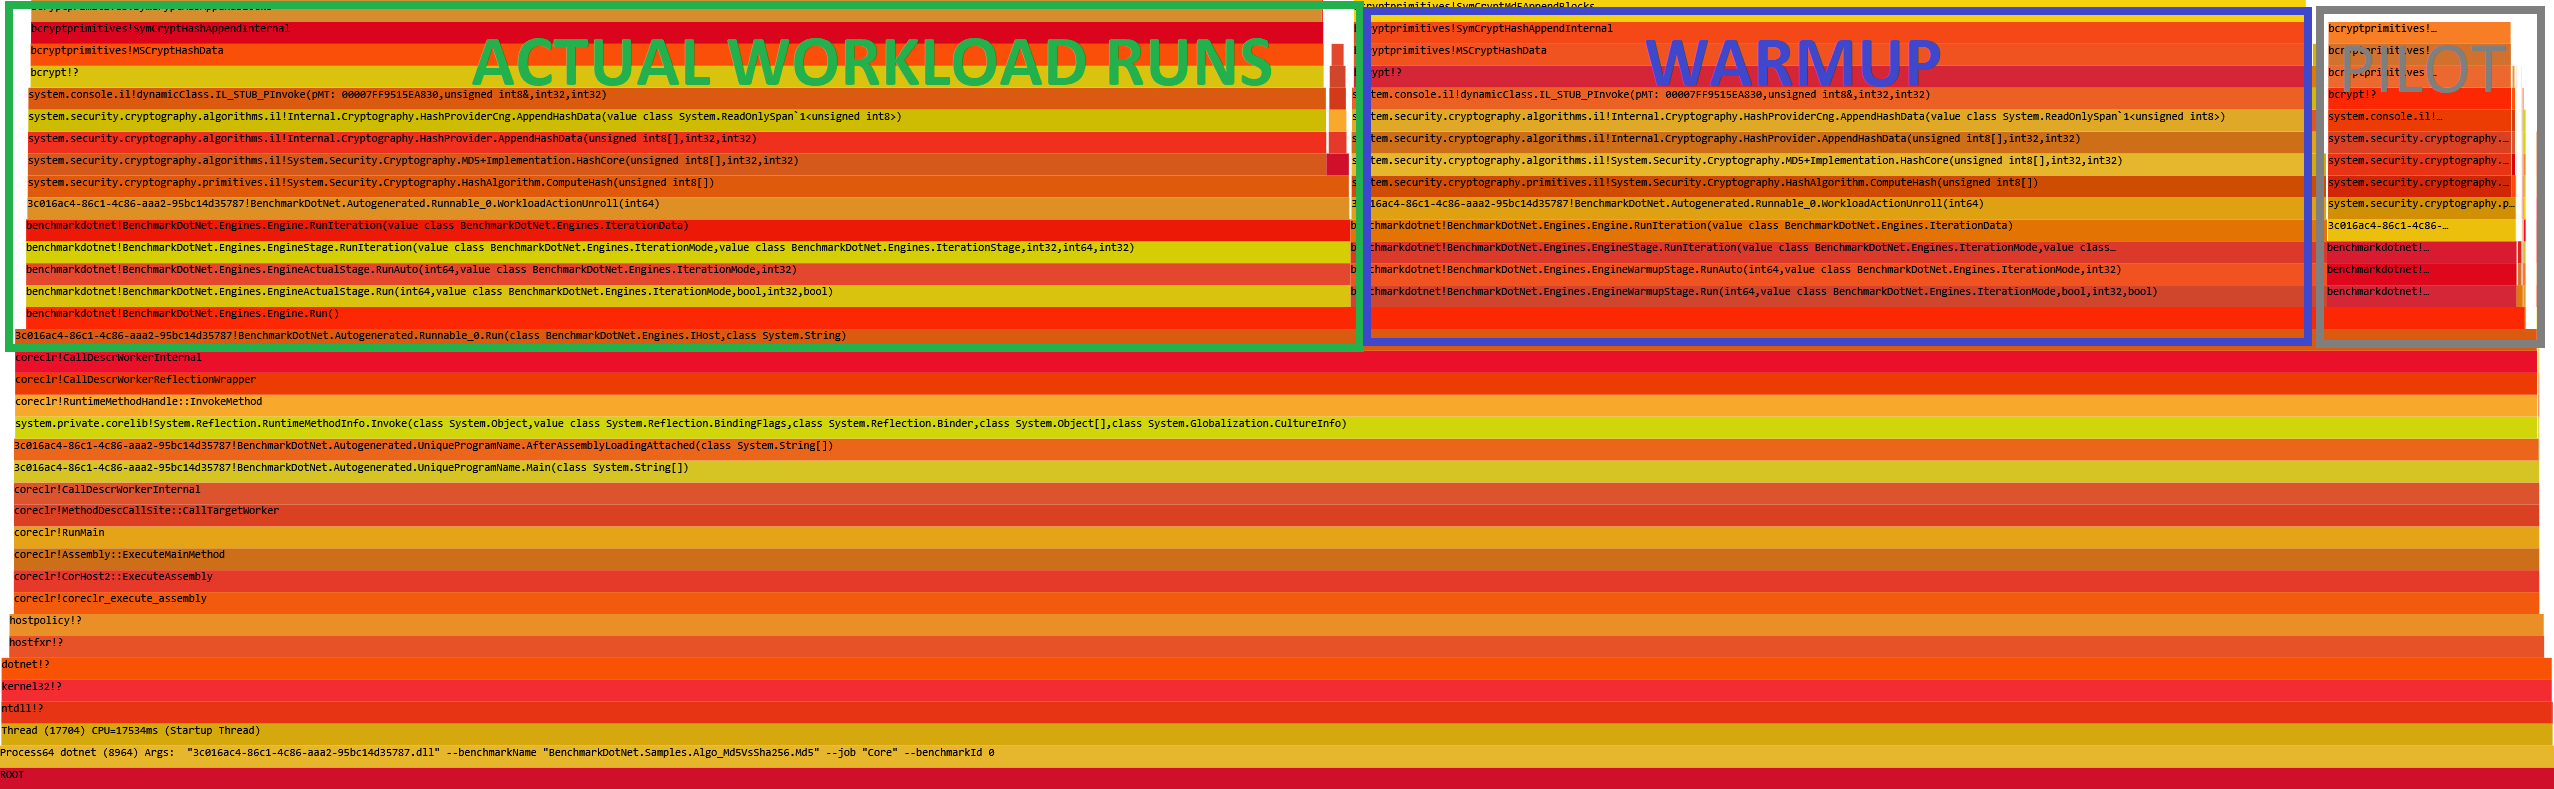
The simplest way to filter the data to the actual benchmarks runs is to open the CallTree tab, put "EngineActualStage" in the Find box, press enter and when PerfView selects EngineActualStage in the CallTree press Alt+R to Set Time Range.
If you want to filter the trace to single iteration, then you must go to the Events panel and search for the WorkloadActual/Start and WorkloadActual/Stop events.
- Open Events window
- Put "WorkloadActual" in the Filter box and hit enter.
- Press control or shift and choose the Start and Stop events from the left panel. Hit enter.
- Choose iteration that you want to investigate (events are sorted by time).
- Select two or more cells from the "Time MSec" column.
- Right click, choose "Open Cpu Stacks".
- Choose the process with benchmarks, right-click, choose "Drill Into"