Diagnosers
A diagnoser can attach to your benchmark and get some useful info.
The current Diagnosers are:
- GC and Memory Allocation (
MemoryDiagnoser) which is cross platform, built-in and is not enabled by default anymore. Please see Adam Sitnik's blog post for all the details. - JIT Stats Diagnoser.
You can find this diagnoser in a separate package with diagnosers for Windows (
BenchmarkDotNet.Diagnostics.Windows):
- JIT Inlining Events (
InliningDiagnoser). You can find this diagnoser in a separate package with diagnosers for Windows (BenchmarkDotNet.Diagnostics.Windows): - JIT Tail Call Events (
TailCallDiagnoser). You can find this diagnoser as well as the (InliningDiagnoser) in a separate package with diagnosers for Windows (BenchmarkDotNet.Diagnostics.Windows): Please see this post for all the details. - Hardware Counter Diagnoser.
You can find this diagnoser in a separate package with diagnosers for Windows (
BenchmarkDotNet.Diagnostics.Windows):.
Please see Adam Sitnik's blog post for all the details. - Disassembly Diagnoser. It allows you to disassemble the benchmarked code to asm, IL and C#/F#. Please see Adam Sitnik's blog post for all the details.
- ETW Profiler (
EtwProfiler). It allows you to not only benchmark, but also profile the code. It's using TraceEvent, which internally uses ETW and exports all the information to a trace file. The trace file contains all of the stack traces captured by the profiler, PDBs to resolve symbols for both native and managed code and captured GC, JIT and CLR events. Please use one of the free tools: PerfView or Windows Performance Analyzer to analyze and visualize the data from trace file. You can find this diagnoser in a separate package with diagnosers for Windows (BenchmarkDotNet.Diagnostics.Windows):
Please see Adam Sitnik's blog post for all the details. - Concurrency Visualizer Profiler (
ConcurrencyVisualizerProfiler) It usesEtwProfilerto profile the code using ETW and create not only.etlfile but also a CVTrace file which can be opened by Concurrency Visualizer plugin from Visual Studio. Please see Adam Sitnik's blog post for all the details. - Native Memory Profiler (
NativeMemoryProfiler) It usesEtwProfilerto profile the code using ETW and adds the extra columnsAllocated native memoryandNative memory leak. Please see Wojciech Nagórski's blog post for all the details. - Event Pipe Profiler (
EventPipeProfiler). It is a cross-platform profiler that allows profile .NET code on every platform - Windows, Linux, macOS. Please see Wojciech Nagórski's blog post for all the details. - Threading Diagnoser (
ThreadingDiagnoser) - .NET Core 3.0+ diagnoser that reports some Threading statistics. - Exception Diagnoser (
ExceptionDiagnoser) - a diagnoser that reports the frequency of exceptions thrown during the operation.
Usage
Below is a sample output from the GC and Memory Allocation diagnoser, note the extra columns on the right-hand side ("Gen 0", "Gen 1", "Gen 2" and "Allocated"):
           Method |        Mean |     StdErr |      Median |  Gen 0 | Allocated |
----------------- |------------ |----------- |------------ |------- |---------- |
 'new byte[10kB]' | 884.4896 ns | 46.3528 ns | 776.4237 ns | 0.1183 |     10 kB |
A config example:
private class Config : ManualConfig
{
    public Config()
    {
        AddDiagnoser(MemoryDiagnoser.Default);
        AddDiagnoser(new InliningDiagnoser());
        AddDiagnoser(new EtwProfiler());
        AddDiagnoser(ThreadingDiagnoser.Default);
        AddDiagnoser(ExceptionDiagnoser.Default);
    }
}
You can also use one of the following attributes (apply it on a class that contains Benchmarks):
[MemoryDiagnoser]
[InliningDiagnoser]
[TailCallDiagnoser]
[EtwProfiler]
[ConcurrencyVisualizerProfiler]
[NativeMemoryProfiler]
[ThreadingDiagnoser]
[ExceptionDiagnoser]
In BenchmarkDotNet, 1kB = 1024B, 1MB = 1024kB, and so on. The column Gen X means number of GC collections per 1000 operations for that generation.
Restrictions
- In order to not affect main results we perform a separate run if any diagnoser is used. That's why it might take more time to execute benchmarks.
- MemoryDiagnoser:
- In order to get the number of allocated bytes in cross platform way we are using
GC.GetAllocatedBytesForCurrentThreadwhich recently got exposed for netcoreapp1.1. That's why BenchmarkDotNet does not support netcoreapp1.0 from version 0.10.1. - MemoryDiagnoser is
99.5%accurate about allocated memory when using default settings or Job.ShortRun (or any longer job than it).
- In order to get the number of allocated bytes in cross platform way we are using
- Threading Diagnoser:
- Works only for .NET Core 3.0+
- HardwareCounters:
- Windows 8+ only (we plan to add Unix support in the future)
- No Hyper-V (Virtualization) support
- Requires running as Admin (ETW Kernel Session)
- No
InProcessToolchainsupport (#394)
- EtwProfiler, ConcurrencyVisualizerProfiler and NativeMemoryProfiler:
- Windows only
- Requires running as Admin (ETW Kernel Session)
- No
InProcessToolchainsupport (#394)
- Disassembly Diagnoser:
- .NET Core disassembler works only on Windows
- Mono disassembler does not support recursive disassembling and produces output without IL and C#.
- Indirect calls are not tracked.
- To be able to compare different platforms, you need to target AnyCPU
<PlatformTarget>AnyCPU</PlatformTarget> - To get the corresponding C#/F# code from disassembler you need to configure your project in following way:
<DebugType>pdbonly</DebugType>
<DebugSymbols>true</DebugSymbols>
Sample: IntroHardwareCounters
This diagnoser is not enabled in explicit way as the other diagnosers.
You need to specify [HardwareCounters] and we choose the right diagnoser in the runtime.
Source code
using System;
using BenchmarkDotNet.Attributes;
using BenchmarkDotNet.Diagnosers;

namespace BenchmarkDotNet.Samples
{
    [HardwareCounters(
        HardwareCounter.BranchMispredictions,
        HardwareCounter.BranchInstructions)]
    public class IntroHardwareCounters
    {
        private const int N = 32767;
        private readonly int[] sorted, unsorted;

        public IntroHardwareCounters()
        {
            var random = new Random(0);
            unsorted = new int[N];
            sorted = new int[N];
            for (int i = 0; i < N; i++)
                sorted[i] = unsorted[i] = random.Next(256);
            Array.Sort(sorted);
        }

        private static int Branch(int[] data)
        {
            int sum = 0;
            for (int i = 0; i < N; i++)
                if (data[i] >= 128)
                    sum += data[i];
            return sum;
        }

        private static int Branchless(int[] data)
        {
            int sum = 0;
            for (int i = 0; i < N; i++)
            {
                int t = (data[i] - 128) >> 31;
                sum += ~t & data[i];
            }
            return sum;
        }

        [Benchmark]
        public int SortedBranch() => Branch(sorted);

        [Benchmark]
        public int UnsortedBranch() => Branch(unsorted);

        [Benchmark]
        public int SortedBranchless() => Branchless(sorted);

        [Benchmark]
        public int UnsortedBranchless() => Branchless(unsorted);
    }
}
Output
| Method | Mean | Mispredict rate | BranchInstructions/Op | BranchMispredictions/Op |
|---|---|---|---|---|
| SortedBranch | 21.4539 us | 0,04% | 70121 | 24 |
| UnsortedBranch | 136.1139 us | 23,70% | 68788 | 16301 |
| SortedBranchless | 28.6705 us | 0,06% | 35711 | 22 |
| UnsortedBranchless | 28.9336 us | 0,05% | 35578 | 17 |
Links
- Diagnosers
- The permanent link to this sample: BenchmarkDotNet.Samples.IntroHardwareCounters
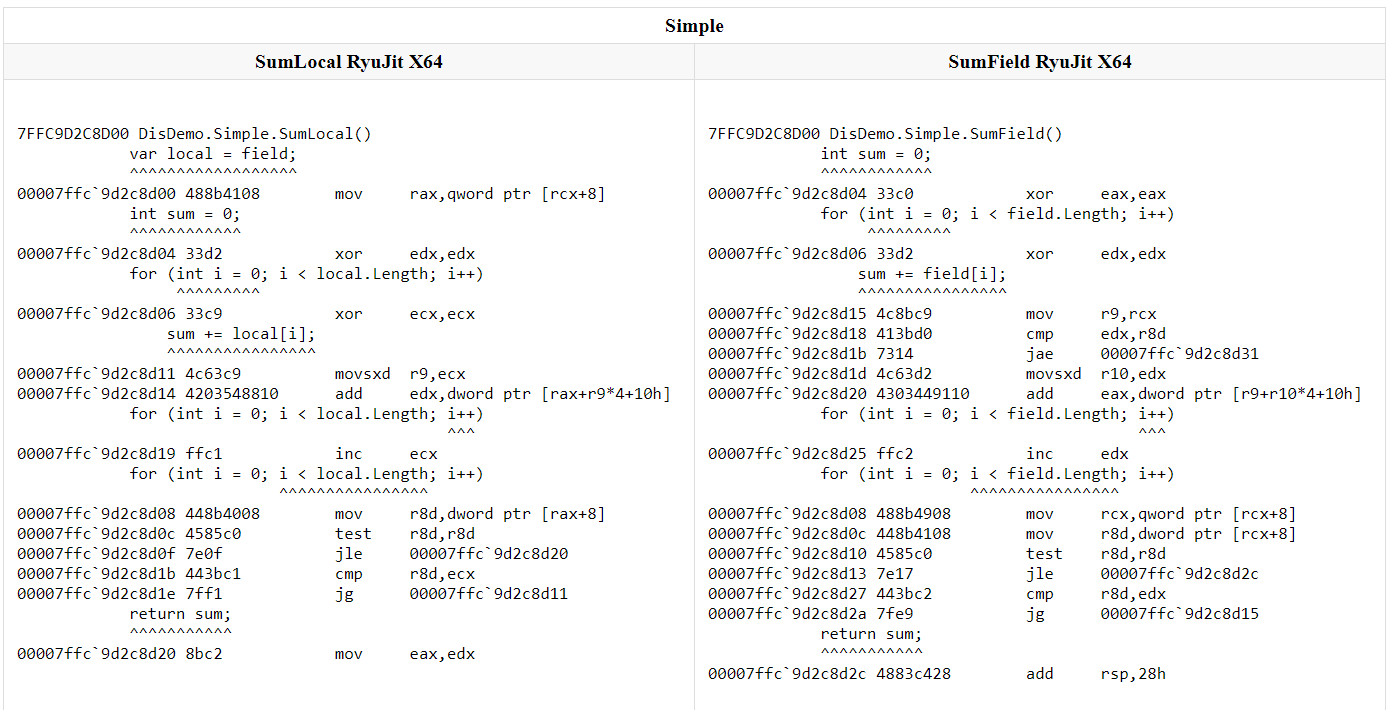
Sample: IntroDisassemblyRyuJit
Source code
using System.Linq;
using BenchmarkDotNet.Attributes;

namespace BenchmarkDotNet.Samples
{
    [DisassemblyDiagnoser(printSource: true)]
    [RyuJitX64Job]
    public class IntroDisassemblyRyuJit
    {
        private int[] field = Enumerable.Range(0, 100).ToArray();

        [Benchmark]
        public int SumLocal()
        {
            var local = field; // we use local variable that points to the field

            int sum = 0;
            for (int i = 0; i < local.Length; i++)
                sum += local[i];

            return sum;
        }

        [Benchmark]
        public int SumField()
        {
            int sum = 0;
            for (int i = 0; i < field.Length; i++)
                sum += field[i];

            return sum;
        }
    }
}
Output
Links
- Diagnosers
- Disassembler
- The permanent link to this sample: BenchmarkDotNet.Samples.IntroDisassemblyRyuJit
Sample: IntroDisassembly
Source code
using BenchmarkDotNet.Attributes;
using BenchmarkDotNet.Diagnosers;
using System.Linq;

namespace BenchmarkDotNet.Samples
{
    [DisassemblyDiagnoser(printInstructionAddresses: true, syntax: DisassemblySyntax.Masm)]
    public class IntroDisassembly
    {
        private int[] field = Enumerable.Range(0, 100).ToArray();

        [Benchmark]
        public int SumLocal()
        {
            var local = field; // we use local variable that points to the field

            int sum = 0;
            for (int i = 0; i < local.Length; i++)
                sum += local[i];

            return sum;
        }

        [Benchmark]
        public int SumField()
        {
            int sum = 0;
            for (int i = 0; i < field.Length; i++)
                sum += field[i];

            return sum;
        }
    }
}
Output
; .NET Framework 4.7.2 (CLR 4.0.30319.42000), 32bit LegacyJIT-v4.7.3110.0
05452718 BenchmarkDotNet.Samples.IntroDisassembly.Sum()
IL_0000: ldc.r8 0
IL_0009: stloc.0
0545271c d9ee            fldz
IL_000a: ldc.i4.0
IL_000b: stloc.1
IL_000c: br.s IL_0017
0545271e 33c0            xor     eax,eax
IL_000e: ldloc.0
IL_000f: ldloc.1
IL_0010: conv.r8
IL_0011: add
IL_0012: stloc.0
05452720 8945fc          mov     dword ptr [ebp-4],eax
05452723 db45fc          fild    dword ptr [ebp-4]
05452726 dec1            faddp   st(1),st
IL_0013: ldloc.1
IL_0014: ldc.i4.1
IL_0015: add
IL_0016: stloc.1
05452728 40              inc     eax
IL_0017: ldloc.1
IL_0018: ldc.i4.s 64
IL_001a: blt.s IL_000e
05452729 83f840          cmp     eax,40h
0545272c 7cf2            jl      05452720
IL_001c: ldloc.0
IL_001d: ret
0545272e 8be5            mov     esp,ebp
; .NET Core 2.1.0 (CoreCLR 4.6.26515.07, CoreFX 4.6.26515.06), 64bit RyuJIT
00007ffa`6c621320 BenchmarkDotNet.Samples.IntroDisassembly.Sum()
IL_0000: ldc.r8 0
IL_0009: stloc.0
00007ffa`6c621323 c4e17857c0      vxorps  xmm0,xmm0,xmm0
IL_000a: ldc.i4.0
IL_000b: stloc.1
IL_000c: br.s IL_0017
00007ffa`6c621328 33c0            xor     eax,eax
IL_000e: ldloc.0
IL_000f: ldloc.1
IL_0010: conv.r8
IL_0011: add
IL_0012: stloc.0
00007ffa`6c62132a c4e17057c9      vxorps  xmm1,xmm1,xmm1
00007ffa`6c62132f c4e1732ac8      vcvtsi2sd xmm1,xmm1,eax
00007ffa`6c621334 c4e17b58c1      vaddsd  xmm0,xmm0,xmm1
IL_0013: ldloc.1
IL_0014: ldc.i4.1
IL_0015: add
IL_0016: stloc.1
00007ffa`6c621339 ffc0            inc     eax
IL_0017: ldloc.1
IL_0018: ldc.i4.s 64
IL_001a: blt.s IL_000e
00007ffa`6c62133b 83f840          cmp     eax,40h
00007ffa`6c62133e 7cea            jl      00007ffa`6c62132a
IL_001c: ldloc.0
IL_001d: ret
00007ffa`6c621340 c3              ret
Mono 5.12.0 (Visual Studio), 64bit
 Sum
sub    $0x18,%rsp
mov    %rsi,(%rsp)
xorpd  %xmm0,%xmm0
movsd  %xmm0,0x8(%rsp)
xor    %esi,%esi
jmp    2e
xchg   %ax,%ax
movsd  0x8(%rsp),%xmm0
cvtsi2sd %esi,%xmm1
addsd  %xmm1,%xmm0
movsd  %xmm0,0x8(%rsp)
inc    %esi
cmp    $0x40,%esi
jl     18
movsd  0x8(%rsp),%xmm0
mov    (%rsp),%rsi
add    $0x18,%rsp
retq
Links
- Diagnosers
- Disassembler
- The permanent link to this sample: BenchmarkDotNet.Samples.IntroDisassembly
Sample: IntroDisassemblyAllJits
You can use a single config to compare the generated assembly code for ALL JITs.
But to allow benchmarking any target platform architecture the project which defines benchmarks has to target AnyCPU.
<PropertyGroup>
  <PlatformTarget>AnyCPU</PlatformTarget>
</PropertyGroup>
Source code
using BenchmarkDotNet.Attributes;
using BenchmarkDotNet.Configs;
using BenchmarkDotNet.Diagnosers;
using BenchmarkDotNet.Environments;
using BenchmarkDotNet.Jobs;

namespace BenchmarkDotNet.Samples
{
    [Config(typeof(MultipleJits))]
    public class IntroDisassemblyAllJits
    {
        public class MultipleJits : ManualConfig
        {
            public MultipleJits()
            {
                AddJob(Job.ShortRun.WithPlatform(Platform.X86).WithRuntime(new MonoRuntime(name: "Mono x86", customPath: @"C:\Program Files (x86)\Mono\bin\mono.exe")));
                AddJob(Job.ShortRun.WithPlatform(Platform.X64).WithRuntime(new MonoRuntime(name: "Mono x64", customPath: @"C:\Program Files\Mono\bin\mono.exe")));

                AddJob(Job.ShortRun.WithJit(Jit.LegacyJit).WithPlatform(Platform.X86).WithRuntime(ClrRuntime.Net462));
                AddJob(Job.ShortRun.WithJit(Jit.LegacyJit).WithPlatform(Platform.X64).WithRuntime(ClrRuntime.Net462));

                AddJob(Job.ShortRun.WithJit(Jit.RyuJit).WithPlatform(Platform.X64).WithRuntime(ClrRuntime.Net462));

                // RyuJit for .NET Core 5.0
                AddJob(Job.ShortRun.WithJit(Jit.RyuJit).WithPlatform(Platform.X64).WithRuntime(CoreRuntime.Core50));

                AddDiagnoser(new DisassemblyDiagnoser(new DisassemblyDiagnoserConfig(maxDepth: 3, exportDiff: true)));
            }
        }

        private Increment increment = new Increment();

        [Benchmark]
        public int CallVirtualMethod() => increment.OperateTwice(10);

        public abstract class Operation  // abstract unary integer operation
        {
            public abstract int Operate(int input);

            public int OperateTwice(int input) => Operate(Operate(input)); // two virtual calls to Operate
        }

        public sealed class Increment : Operation // concrete, sealed operation: increment by fixed amount
        {
            public readonly int Amount;
            public Increment(int amount = 1) { Amount = amount; }

            public override int Operate(int input) => input + Amount;
        }
    }
}
Output
The disassembly result can be obtained here. The file was too big to embed it in this doc page.
Links
- Diagnosers
- Disassembler
- The permanent link to this sample: BenchmarkDotNet.Samples.IntroDisassemblyAllJits
Sample: IntroDisassemblyDry
Getting only the Disassembly without running the benchmarks for a long time.
Sometimes you might be interested only in the disassembly, not the results of the benchmarks. In that case you can use Job.Dry which runs the benchmark only once.
Source code
using BenchmarkDotNet.Attributes;

namespace BenchmarkDotNet.Samples
{
    [DisassemblyDiagnoser(maxDepth: 3)]
    [DryJob]
    public class IntroDisassemblyDry
    {
        [Benchmark]
        public void Foo()
        {

        }
    }
}
Links
- Diagnosers
- Disassembler
- The permanent link to this sample: BenchmarkDotNet.Samples.IntroDisassemblyDry
Sample: IntroTailcall
You need to use the TailcallDiagnoser attribute to configure it. The available options are:
- logFailuresOnly: Track only the methods that failed to get tail called. True by default.
- filterByNamespace : Track only the methods from declaring type's namespace. Set to false if you want to see all Jit tail events. True by default.
Restrictions
- Windows only
- x64
Source code
using BenchmarkDotNet.Attributes;

namespace BenchmarkDotNet.Samples
{
    [Diagnostics.Windows.Configs.TailCallDiagnoser]
    [LegacyJitX86Job, LegacyJitX64Job, RyuJitX64Job]
    public class IntroTailcall
    {
        [Benchmark]
        public long Calc()
            => FactorialWithoutTailing(7) - FactorialWithTailing(7);

        private static long FactorialWithoutTailing(int depth)
            => depth == 0 ? 1 : depth * FactorialWithoutTailing(depth - 1);

        private static long FactorialWithTailing(int pos, int depth)
            => pos == 0 ? depth : FactorialWithTailing(pos - 1, depth * pos);

        private static long FactorialWithTailing(int depth)
            => FactorialWithTailing(depth - 1, depth);
    }
}
Output
// * Diagnostic Output - TailCallDiagnoser *
--------------------

--------------------
Jit_TailCalling.Calc: LegacyJitX64(Jit=LegacyJit, Platform=X64, Runtime=Clr)
--------------------

--------------------
Jit_TailCalling.Calc: LegacyJitX86(Jit=LegacyJit, Platform=X86, Runtime=Clr)
--------------------

--------------------
Jit_TailCalling.Calc: RyuJitX64(Jit=RyuJit, Platform=X64)
--------------------
Caller: <null>.<null> - <null>
Callee: BenchmarkDotNet.Samples.JIT.Jit_TailCalling.FactorialWithTailing - int64  (int32,int32)
Tail prefix: False
Tail call type: RecursiveLoop
-------------------
Links
- Diagnosers
- The permanent link to this sample: BenchmarkDotNet.Samples.IntroTailcall
Sample: IntroJitStatsDiagnoser
This diagnoser shows various stats from the JIT compiler that were collected during entire benchmark run (warmup phase and BenchmarkDotNet-generated boilerplate code are included):
- Amount of JITted methods.
- Amount of tiered methods.
- How much memory JIT allocated during the benchmark.
Restrictions
- Windows only
Source code
using System.Threading;
using BenchmarkDotNet.Attributes;

namespace BenchmarkDotNet.Samples
{
    [Diagnostics.Windows.Configs.JitStatsDiagnoser]
    public class IntroJitStatsDiagnoser
    {
        [Benchmark]
        public void Sleep() => Thread.Sleep(10);
    }
}
Output
| Method | Mean | Error | StdDev | Methods JITted | Methods Tiered | JIT allocated memory |
|---|---|---|---|---|---|---|
| Sleep | 15.50 ms | 0.052 ms | 0.048 ms | 1,102 | 214 | 221,736 B |
Links
- Diagnosers
- The permanent link to this sample: BenchmarkDotNet.Samples.IntroJitStatsDiagnoser
Sample: IntroNativeMemory
The NativeMemoryProfiler uses EtwProfiler to profile the code using ETW and adds the extra columns Allocated native memory and Native memory leak to the benchmark results table.
Source code
using System;
using System.Drawing;
using System.Runtime.InteropServices;
using BenchmarkDotNet.Attributes;
using BenchmarkDotNet.Diagnostics.Windows.Configs;
using BenchmarkDotNet.Filters;

namespace BenchmarkDotNet.Samples
{
    [ShortRunJob]
    [NativeMemoryProfiler]
    [MemoryDiagnoser]
    public class IntroNativeMemory
    {
#pragma warning disable CA1416
        [Benchmark, WindowsOnly]
        public void BitmapWithLeaks()
        {
            var flag = new Bitmap(200, 100);
            var graphics = Graphics.FromImage(flag);
            var blackPen = new Pen(Color.Black, 3);
            graphics.DrawLine(blackPen, 100, 100, 500, 100);
        }

        [Benchmark, WindowsOnly]
        public void Bitmap()
        {
            using (var flag = new Bitmap(200, 100))
            {
                using (var graphics = Graphics.FromImage(flag))
                {
                    using (var blackPen = new Pen(Color.Black, 3))
                    {
                        graphics.DrawLine(blackPen, 100, 100, 500, 100);
                    }
                }
            }
        }
#pragma warning restore CA1416

        private const int Size = 20; // Greater value could cause System.OutOfMemoryException for test with memory leaks.
        private int ArraySize = Size * Marshal.SizeOf(typeof(int));

        [Benchmark]
        public unsafe void AllocHGlobal()
        {
            IntPtr unmanagedHandle = Marshal.AllocHGlobal(ArraySize);
            Span<byte> unmanaged = new Span<byte>(unmanagedHandle.ToPointer(), ArraySize);
            Marshal.FreeHGlobal(unmanagedHandle);
        }

        [Benchmark]
        public unsafe void AllocHGlobalWithLeaks()
        {
            IntPtr unmanagedHandle = Marshal.AllocHGlobal(ArraySize);
            Span<byte> unmanaged = new Span<byte>(unmanagedHandle.ToPointer(), ArraySize);
        }

        private class WindowsOnlyAttribute : FilterConfigBaseAttribute
        {
            public WindowsOnlyAttribute()
                : base(new SimpleFilter(_ => RuntimeInformation.IsOSPlatform(OSPlatform.Windows)))
            {
            }
        }
    }
}
Output
| Method | Mean | Error | StdDev | Gen 0 | Gen 1 | Gen 2 | Allocated | Allocated native memory | Native memory leak |
|---|---|---|---|---|---|---|---|---|---|
| BitmapWithLeaks | 73,456.43 ns | 22,498.10 ns | 1,233.197 ns | - | - | - | 177 B | 13183 B | 11615 B |
| Bitmap | 91,590.08 ns | 101,468.12 ns | 5,561.810 ns | - | - | - | 180 B | 12624 B | - |
| AllocHGlobal | 79.91 ns | 43.93 ns | 2.408 ns | - | - | - | - | 80 B | - |
| AllocHGlobalWithLeaks | 103.50 ns | 153.21 ns | 8.398 ns | - | - | - | - | 80 B | 80 B |
Profiling memory leaks
The BenchmarkDotNet repeats benchmarking function many times. Sometimes it can cause a memory overflow. In this case, the BenchmarkDotNet shows the message:
OutOfMemoryException!
BenchmarkDotNet continues to run additional iterations until desired accuracy level is achieved. It's possible only if the benchmark method doesn't have any side-effects.
If your benchmark allocates memory and keeps it alive, you are creating a memory leak.
You should redesign your benchmark and remove the side-effects. You can use `OperationsPerInvoke`, `IterationSetup` and `IterationCleanup` to do that.
In this case, you should try to reduce the number of invocation, by adding [ShortRunJob] attribute or using Job.Short for custom configuration.
Links
- Diagnosers
- The permanent link to this sample: BenchmarkDotNet.Samples.IntroNativeMemory
Sample: IntroThreadingDiagnoser
The ThreadingDiagnoser uses new APIs exposed in .NET Core 3.0 to report:
- Completed Work Items: The number of work items that have been processed in ThreadPool (per single operation)
- Lock Contentions: The number of times there was contention upon trying to take a Monitor's lock (per single operation)
Source code
using BenchmarkDotNet.Attributes;
using System.Threading;

namespace BenchmarkDotNet.Samples
{
    [ThreadingDiagnoser] // ENABLE the diagnoser
    public class IntroThreadingDiagnoser
    {
        [Benchmark]
        public void CompleteOneWorkItem()
        {
            ManualResetEvent done = new ManualResetEvent(initialState: false);

            ThreadPool.QueueUserWorkItem(m => (m as ManualResetEvent).Set(), done);

            done.WaitOne();
        }
    }
}
Output
| Method | Mean | StdDev | Median | Completed Work Items | Lock Contentions |
|---|---|---|---|---|---|
| CompleteOneWorkItem | 8,073.5519 ns | 69.7261 ns | 8,111.6074 ns | 1.0000 | - |
Links
- Diagnosers
- The permanent link to this sample: BenchmarkDotNet.Samples.IntroThreadingDiagnoser
Sample: IntroExceptionDiagnoser
The ExceptionDiagnoser uses AppDomain.FirstChanceException API to report:
- Exception frequency: The number of exceptions thrown during the operations divided by the number of operations.
Source code
using BenchmarkDotNet.Attributes;
using System;

namespace BenchmarkDotNet.Samples
{
    [ExceptionDiagnoser]
    public class IntroExceptionDiagnoser
    {
        [Benchmark]
        public void ThrowExceptionRandomly()
        {
            try
            {
                if (new Random().Next(0, 5) > 1)
                {
                    throw new Exception();
                }
            }
            catch
            {
                // ignored
            }
        }
    }
}
Output
| Method | Mean | Error | StdDev | Exception frequency |
|---|---|---|---|---|
| ThrowExceptionRandomly | 4.936 us | 0.1542 us | 0.4499 us | 0.1381 |
Links
- Diagnosers
- The permanent link to this sample: BenchmarkDotNet.Samples.IntroExceptionDiagnoser