EventPipeProfiler
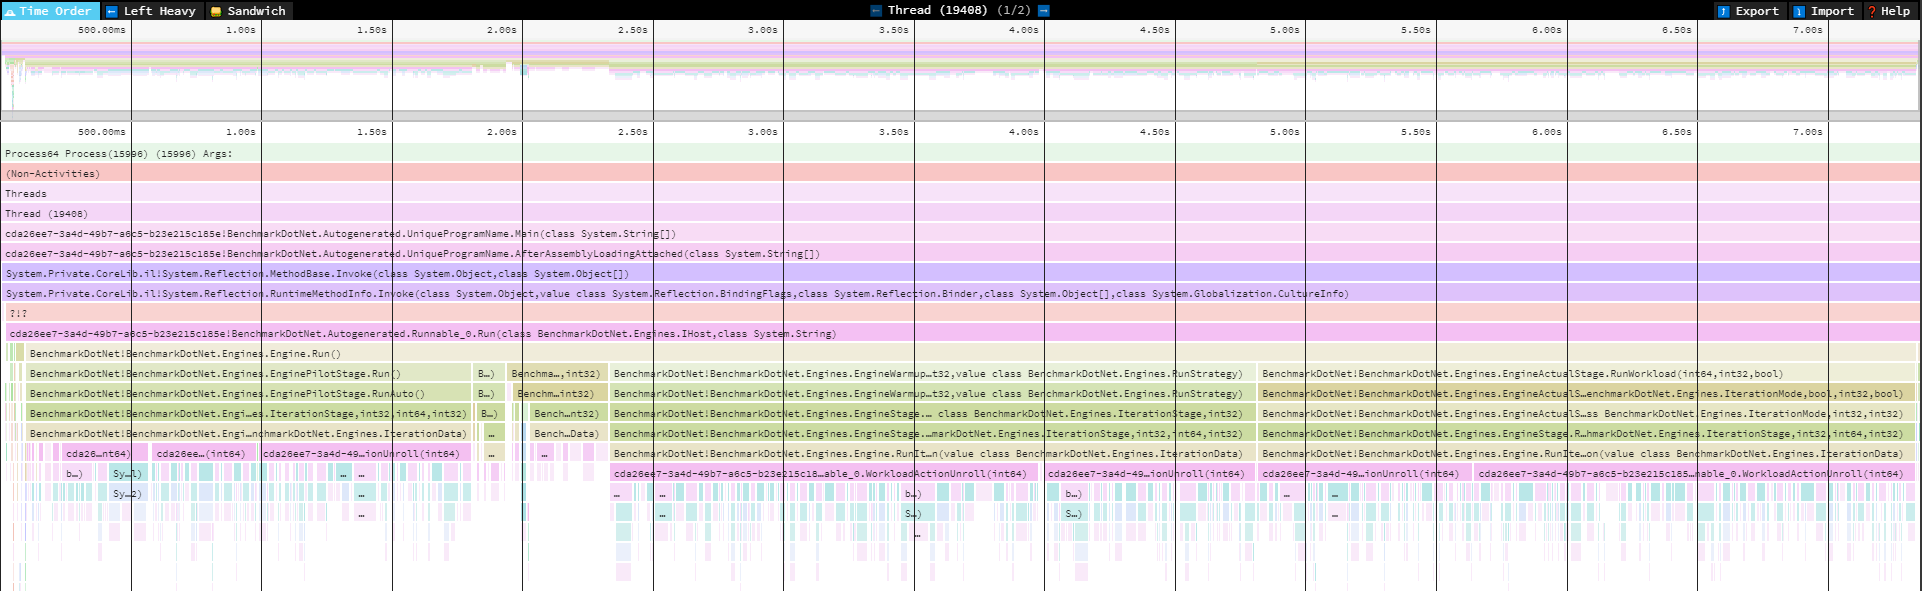
EventPipeProfiler is a cross-platform profiler that allows profile .NET code on every platform - Windows, Linux, macOS. Collected data are exported to trace files (.speedscope.json and .nettrace) which can be analyzed using SpeedScope, PerfView, and Visual Studio Profiler. This new profiler is available from the 0.12.1 version.
Configuration
EventPipeProfiler can be enabled in three ways:
- Using parameter
-p EPor--profiler EPfrom the console line. - Marking the benchmarked class with
[EventPipeProfiler(...)]attribute. You can find an example below. - Using a custom configuration. You can find an example below.
Sample: EventPipeProfiler
The EventPipeProfiler can be enabled using the [EventPipeProfiler(...)] attribute. This attribute takes the following profiles:
CpuSampling- Useful for tracking CPU usage and general .NET runtime information. This is the default option.GcVerbose- Tracks GC collections and samples object allocations.GcCollect- Tracks GC collections only at very low overhead.Jit- Logging when Just in time (JIT) compilation occurs. Logging of the internal workings of the Just In Time compiler. This is fairly verbose. It details decisions about interesting optimization (like inlining and tail call)
Source code
using System.Threading;
using BenchmarkDotNet.Attributes;
using BenchmarkDotNet.Diagnosers;

namespace BenchmarkDotNet.Samples
{
    [ShortRunJob]
    [EventPipeProfiler(EventPipeProfile.CpuSampling)]
    public class IntroEventPipeProfiler
    {
        [Benchmark]
        public void Sleep() => Thread.Sleep(2000);
    }
}
Output
The output should contain information about the exported trace file which can be analyzed using SpeedScope.
// * Diagnostic Output - EventPipeProfiler *
Exported 1 trace file(s). Example:
C:\Work\BenchmarkDotNet\samples\BenchmarkDotNet.Samples\BenchmarkDotNet.Artifacts\BenchmarkDotNet.Samples.IntroEventPipeProfiler.Sleep-20200406-090113.speedscope.json
Sample: EventPipeProfilerAdvanced
The most advanced and powerful way to use EventPipeProfiler is a custom configuration. As you can see the below configuration adds EventPipeProfiler that constructor can take the profile and/or a list of providers.
Both EventPipeProfiler and dotnet trace use the Microsoft.Diagnostics.NETCore.Client package internally. So before you start using the custom configuration of this profiler, it is worth reading the documentation here and here where you can find more information about how to configure provider list.
Source code
using System.Buffers;
using System.Diagnostics.Tracing;
using BenchmarkDotNet.Attributes;
using BenchmarkDotNet.Configs;
using BenchmarkDotNet.Diagnosers;
using BenchmarkDotNet.Environments;
using BenchmarkDotNet.Jobs;
using Microsoft.Diagnostics.NETCore.Client;
using Microsoft.Diagnostics.Tracing.Parsers;

namespace BenchmarkDotNet.Samples
{
    [Config(typeof(CustomConfig))]
    public class IntroEventPipeProfilerAdvanced
    {
        private class CustomConfig : ManualConfig
        {
            public CustomConfig()
            {
                AddJob(Job.ShortRun.WithRuntime(CoreRuntime.Core50));

                var providers = new[]
                {
                    new EventPipeProvider(ClrTraceEventParser.ProviderName, EventLevel.Verbose,
                        (long) (ClrTraceEventParser.Keywords.Exception
                        | ClrTraceEventParser.Keywords.GC
                        | ClrTraceEventParser.Keywords.Jit
                        | ClrTraceEventParser.Keywords.JitTracing // for the inlining events
                        | ClrTraceEventParser.Keywords.Loader
                        | ClrTraceEventParser.Keywords.NGen)),
                    new EventPipeProvider("System.Buffers.ArrayPoolEventSource", EventLevel.Informational, long.MaxValue),
                };

                AddDiagnoser(new EventPipeProfiler(providers: providers));
            }
        }

        [Benchmark]
        public void RentAndReturn_Shared()
        {
            var pool = ArrayPool<byte>.Shared;
            byte[] array = pool.Rent(10000);
            pool.Return(array);
        }
    }
}
Output
The output should contain information about the exported trace file which can be analyzed using SpeedScope.
// * Diagnostic Output - EventPipeProfiler *
Exported 1 trace file(s). Example:
C:\Work\BenchmarkDotNet\samples\BenchmarkDotNet.Samples\BenchmarkDotNet.Artifacts\BenchmarkDotNet.Samples.IntroEventPipeProfilerAdvanced.RentAndReturn_Shared-20200406-090136.speedscope.json